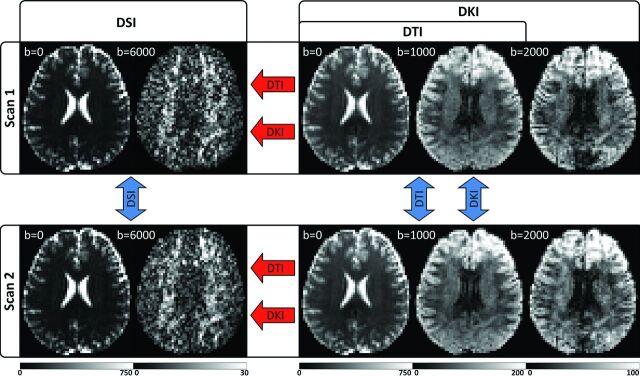
Fig 1.
Experimental design illustrated with sample images from a single subject. For each subject, 2 separate scans are obtained, which include independent DSI and DKI acquisitions optimized for the respective reconstructions. The DTI reconstruction is calculated from a subset of the DKI acquisition and is fully independent of the DSI scan but not the DKI scan. Angular variability is calculated between scans (blue arrows), and angular error is calculated for DKI and DTI in reference to the corresponding DSI scan (red arrows). Units for the b-value are second/square millimeter, and the signal intensity ranges for each image are given by the corresponding color bar (in arbitrary units). DWIs from the highest b-value for each acquisition are given to illustrate the range of diffusion-weighting applied.

