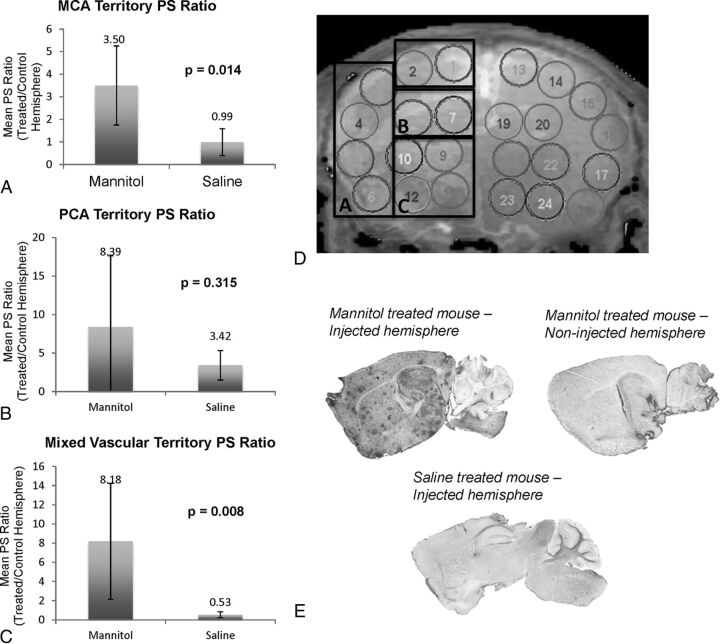
Fig 3.
A–C, Mean PS ratio (injected hemisphere/contralateral noninjected hemisphere) per vascular territory in mannitol-treated mice versus saline controls. Top of the column represents the mean value, and error bars represent the SD. D, ROI placement on a representative coronal image. Boxed areas (A–C) correspond to vascular territory ROIs for MCA, PCA, and mixed territories, respectively. E, Immunoperoxidase staining on a sagittal section of a mannitol-treated mouse in the injected hemisphere, its contralateral noninjected hemisphere, and a saline-injected hemisphere demonstrate the effect of mannitol-mediated BBB disruption on transgene expression. Darker regions correspond to increased tripeptidyl peptidase-1 expression.

