
Fig 1.
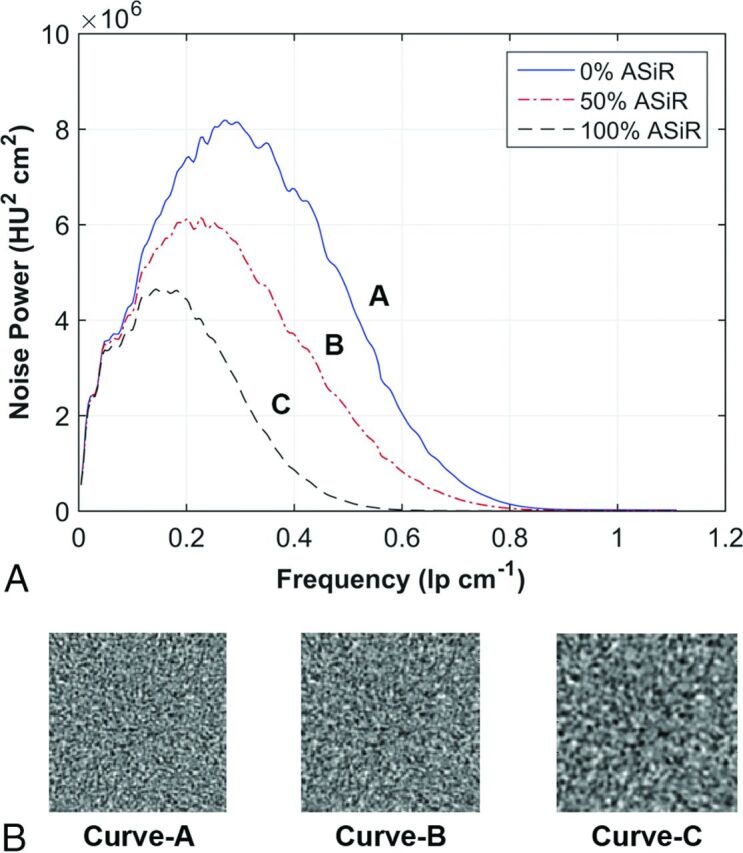
Texture of image noise as it appears in reconstructed images changes as the mean of the NPS curve shifts along the abscissa; shifts in mean NPS frequency are associated with changes in the appearance of image noise texture. A, NPS curves of the standard reconstruction kernel are reconstructed at 3 levels of ASIR. B, A corresponding ROI of 128 × 128 pixels from the center of a water phantom shows the appearance of the noise texture as it correlates with a 32% shift in NPS mean frequency along the abscissa from curve A to B and a 52% shift in curve A to C.