
Fig 2.
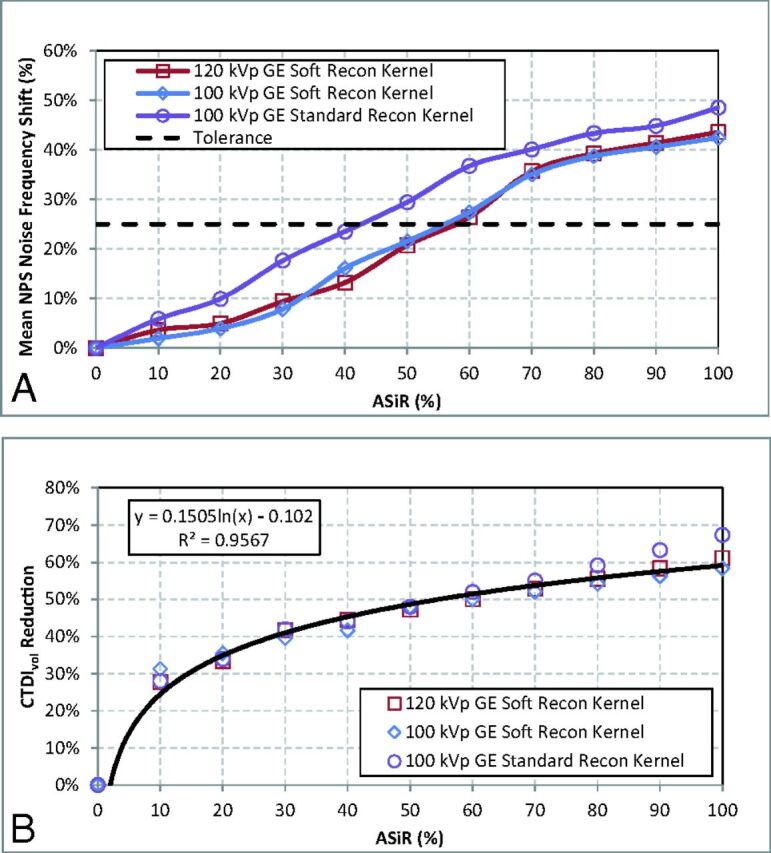
Dose-reduced ASIR protocols compare the mean NPS frequency shift (A) as a function of the level of ASIR reconstruction. An acceptable tolerance for the appearance of noise texture in the reconstructed image is reported in the literature,4,5,20,21 based on a 25% shift of NPS noise frequency (dashed line). B, Corresponding reductions of CTDIvol for the protocols by using ASIR are plotted and fit by using a log-regression function.