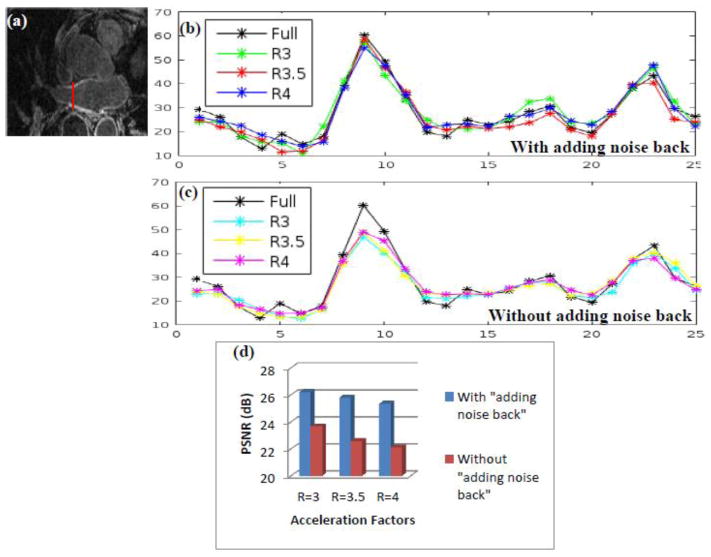
Fig 3.
A comparison of the constrained SB formulation (with “adding noise back” step) with the unconstrained SB formulation (without “adding noise back” step). (b) Plot of a line across of the LA wall for the images in Fig 2 that correspond to the constrained SB formulation, the location shown by the thin red vertical line in (a). For all of the three acceleration factors, the peaks of the curves from the reconstructed images match the truth. (c) Plot of a line across the LA wall for the images in Fig 1 that correspond to the unconstrained SB formulation. For all of the three acceleration factors, the peaks of the curves from the reconstructed images are lower than the truth. (d) The comparison of PSNR for the unconstrained SB images in Fig 1 and constrained SB images in Fig 2. The PSNR with constrained SB formulation is higher than the unconstrained SB formulation for all three acceleration factors. These results show that the constrained SB formulation that uses the “adding noise back” step can reconstruct images with better contrast and sharper edges.

