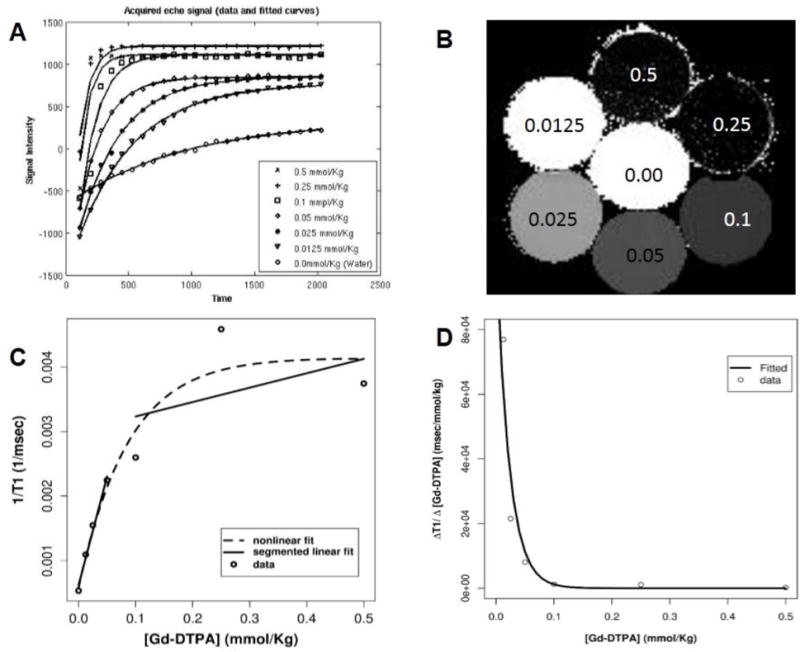
Figure 1. Relationship between [Gd-DTPA] and T1 acquired by a fast T1 mapping is nonlinear.

A) The acquired echo signals with the fitted curves to calculate T1 for different [Gd-DTPA]. B) Illustration of T1 map of coronal section of the phantom (2mm thickness). [Gd-DTPA] (mmol/kg) for each bottle of the phantom is shown over each circle for various concentrations from zero to 0.5 mmol/kg. C) Relationship between T1 and [Gd-DTPA] for concentrations less than 0.5 mmol/kg is represented. Open circles represent sampled values for 1/T1 for different doses of Gd-DTPA. Dotted line represent a biexponential fit to the data. Solid lines represent a segmented linear fit to the data. There are two linear models for the lower dose and higher dose of Gd-DTPA. D) The ratio of changes of T1 over the change of [Gd-DTPA] for different dose of Gd-DTPA is illustrated.
