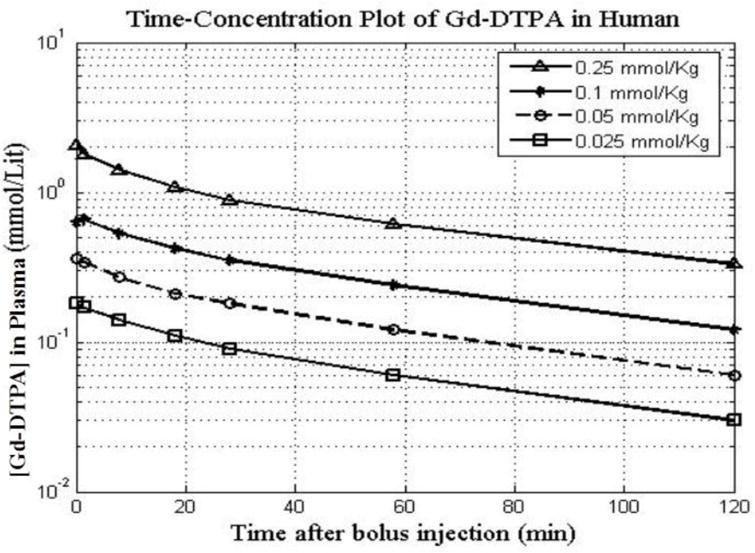
Figure 2. Time-concentration profile of clinical laboratory data of Gd-DTPA after an i.v. bolus administration of four different boluses of Gd-DTPA.

Data and fitted curves for 120 mins after the bolus injection are represented. Concentration-time data of Gd-DTPA for four different aqueous solution i.v. bolus-injected dose of 0.25, 0.1, 0.05, and 0.025 mmol/kg with the fitted curves for 120 mins after the bolus administration are represented. Each dose was i.v. bolus administered to a group of 5 controls. Concentration of Gd-DTPA was sampled by drawing blood and recording for two hours after the i.v. injection. It is safe to assume that in a healthy condition Gd-DTPA homogenously distributed through the body with body tissue density of 1 kg/L, thus the concentration of mmol/kg is equal to mmol/L.
