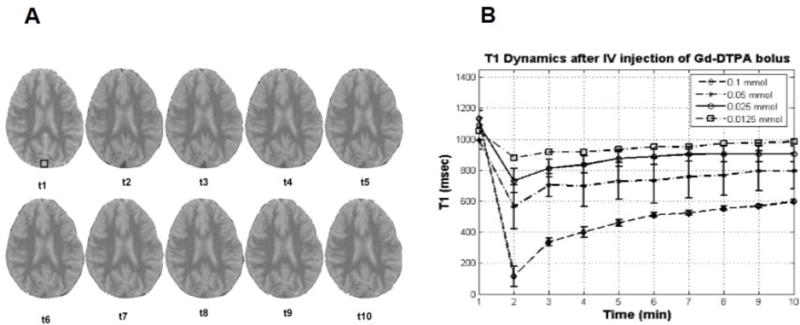
Figure 3. Dynamics of T1 for different dose of i.v. bolus of Gd-DTPA as sampled from inferior and superior sagittal sinuses.

A) A representative series of T1 maps showing changes in the contrast as a result of Gd-DTPA dynamics. Inferior and superior sagittal sinuses sampled to represent the concentration of Gd-DTPA in the plasma. B) T1 changes for four different doses of Gd-DTPA are represented. For each dose the first T1 is sampled before the bolus injection. The nine other consecutive samples of T1 acquired after the bolus injection. In this figure T1 dynamics is shown with error bars for four groups of subjects. The curve is connecting the mean values for each group and represents the mean of T1 dynamics.
