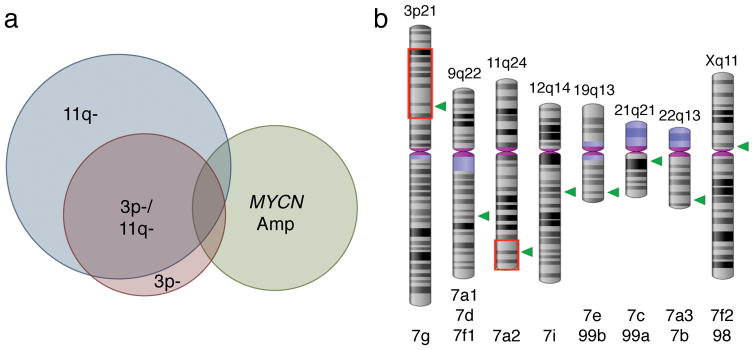
Figure 4. Let-7a2 and let-7g are commonly lost in neuroblastoma.
(a) Scaled Venn diagram assembled from Pugh, et. al., (2013) detailing relative incidence and intersection of chromosome 11q and 3p loss and MYCN amplification.. (b) Genetic locations of 12 distinct let-7 family members. Green triangles let-7 loci. Red boxes indicate the SRO for these deletions. (Images created at: http://www.ncbi.nlm.nih.gov/genome/tools/gdp/).

