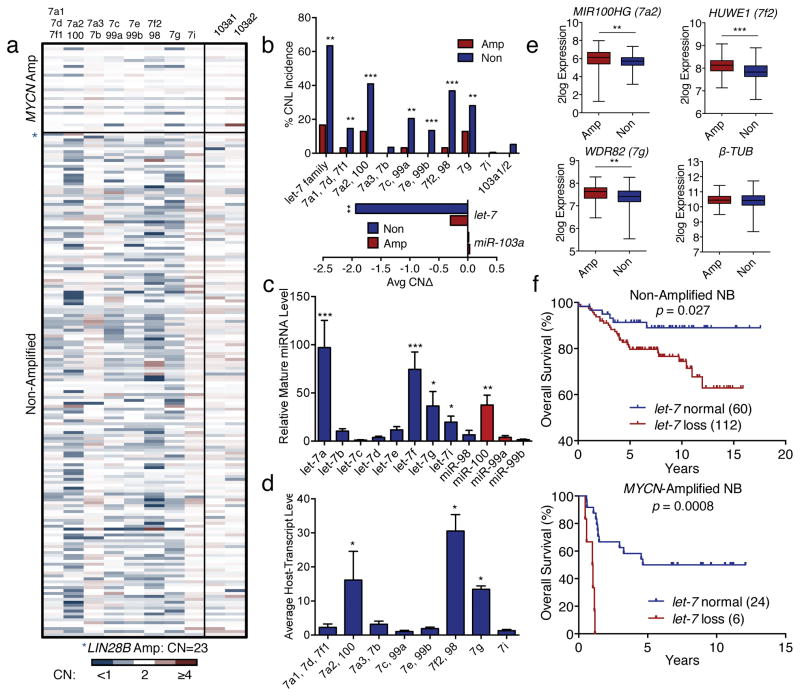
Figure 5. The MYCN aceRNA model predicts let-7 chromosomal loss patterns in neuroblastoma.
(a) let-7 and miR-103a loci CN heat map based on aCGH relative fluorescence ratios of tumor vs. germline. (Source Data F5). (b) CN loss incidence for let-7 and miR-103a from dataset in a (upper panel). Average CN change for the two miRNA families (lower panel). (*p<0.05, **p<0.01, ***p<0.001 amp vs. non for each locus, unpaired t-test, Source Data F5) (c) Mature let-7 expression based on ENCODE sRNA-seq data. (*p<0.05, **p<0.01, ***p<0.001 vs. let-7c, Wilcoxon test, Source Data F5) (d) Relative let-7 host transcript levels based on ENCODE mRNA-seq data. (*p<0.05, **p<0.01 vs. let-7c, Wilcoxon test, Source Data 3) (e) Relative expression of indicated host genes in MYCN-amplified and non-amplified neuroblastoma. β-TUB shown as control. (n = 498, **p<0.01, ***p<0.001, unpaired t-test, Source Data F5). (f) Overall survival curves of neuroblastoma patients in non-amplified (top panel), and MYCN-amplified (bottom panel) neuroblastoma. p-values determined by Mantel-Cox test (Source Data F5).

