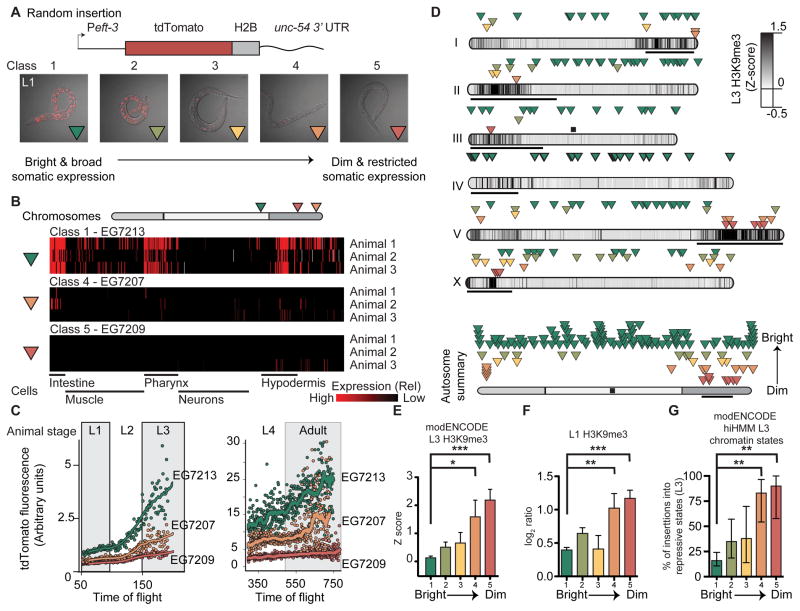
Figure 2. Somatic transgene silencing is frequent on chromosome arms.
A. Top. Schematic of the Peft-3:tdTomato transgene. Bottom. Overlay of tdTomato fluorescence and transmitted light images (identical exposure) of representative L1 animals from each expression class.
B. Automated analysis of single cell fluorescence in L1 animals (Liu et al., 2009) of one bright and two dimmer Peft-3:tdTomato:h2b insertions. Each horizontal line represents replicate imaging of different animals from the same strain. The brightness of each red vertical line indicates the level of tdTomato fluorescence in individual, identified cells. Gray indicates failed cell identification. The cells are clustered based on general classes of tissue and indicated below.
C. tdTomato fluorescence intensity at different larval stages (L1 to adult) based on flow cytometry (Dupuy et al., 2007). Average peak tdTomato fluorescence is indicated for each animal with a dot and the line indicates a smoothed average of peak fluorescence.
D. Top. Genomic location and average brightness of each strain (Green: bright & broad expression, red: dim and restricted expression). Darker chromosome shading indicates higher H3K9me3 density at the L3 stage (Liu et al., 2010), black bars indicate the approximate location of pairing centers (MacQueen et al., 2005), and the black box indicates the endogenous location of eft-3. Bottom. Aggregate normalized autosome with all insertions.
E. Average H3K9me3 Z score in L3 animals (Liu et al., 2010) in a 2 kb interval centered on insertions from each class.
F. Average H3K9me3 level (this work) in starved L1 animals in a 2 kb interval centered on insertions from each class. Log2 ratio between sample and input.
Panels E–F: Average ± SEM. Statistics: Mann-Whitney test (** P< 0.01, *** P < 0.001).
G. Percentage of inserts from each class (Class 1 – Class 5) that was inserted into repressive chromatin states (Polycomb or heterochromatin, states 10–13) identified at the L3 stage based on hierarchical non-parametric machine-learning (hiHMM) (Ho et al., 2014). Error bars indicate 95% confidence interval. Statistics: Fischer’s exact test of Class 1 (brightest) compared to Classes 2–5 (dimmer) (** P< 0.01).
See also Figure S2 and Table S2 for higher resolution images and expression quantification.

