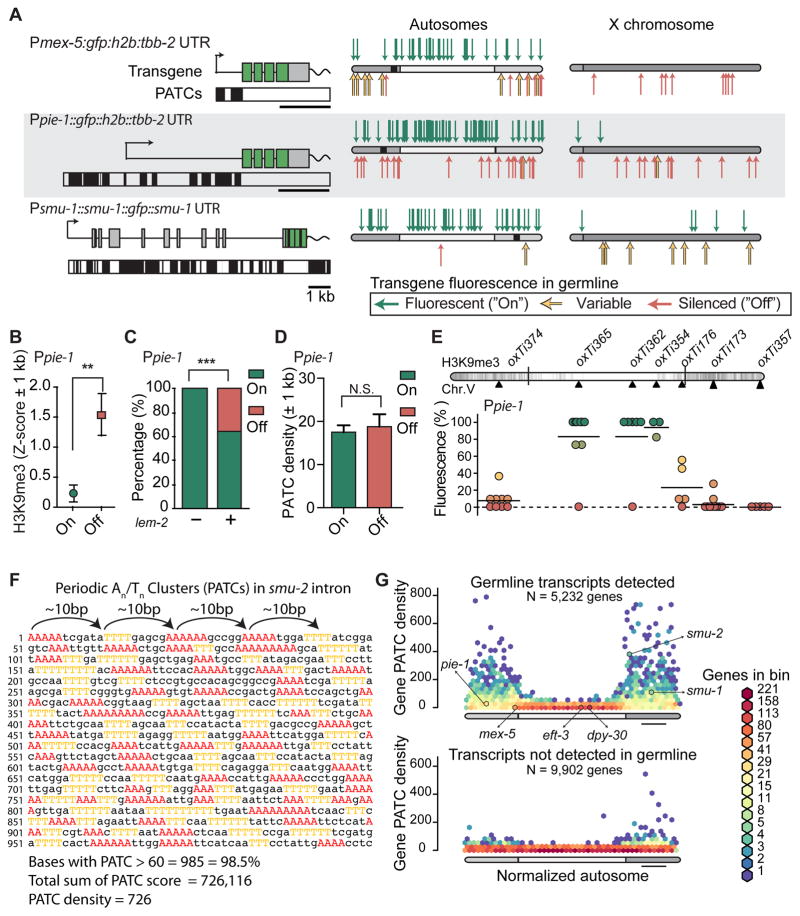
Figure 3. Transgenes containing PATCs are less frequently silenced.
A. Expression of Ppie-1:gfp, Pmex-5:gfp and smu-1:gfp transgenes. Left: transgene schematics with PATCs >60 indicated below as black boxes. Right. Location and germline expression of insertions on aggregated autosomes and the X-chromosome. Endogenous locations of pie-1, mex-5, and smu-1 are indicated with black squares.
B. Local chromatin environment (2kb interval centered on insertion sites) near Ppie-1 insertions. H3K9me3 signal from early embryos (Liu et al., 2010), which have been used as a proxy for germline tissue (Rechtsteiner et al., 2010). Mean ± SEM. Statistical test: Mann Whitney (** = P < 0.01).
C. Local chromatin interactions with nuclear lamin (2 kb interval) near Ppie-1 insertions. Nuclear lamin interactions based on ChIP-sequencing on mixed stage embryos with an antibody against the transmembrane nuclear protein lem-2 (Ikegami et al., 2010). Mean ± SEM. Fischer’s exact test (*** = P < 0.001).
D. Local PATC density (2 kb interval) near Ppie-1 insertions. Mean ± SEM. Statistical test: Mann Whitney (N.S. = not significant).
E. Germline expression of targeted, single-copy Ppie-1:GFP:H2B:tbb-2 UTR insertions into universal MosSCI sites on Chr. V (see also Figure S1). Circles indicate independent transgene insertions that are color coded for each insertion’s expression in the germline (11 animals scored, horizontal bar = mean of independent insertions). Darker chromosome shades correspond to higher H3K9me3 density in early embryos (Liu et al., 2010).
F. Example of a Periodic An/Tn Cluster (PATC) from intron 3 of smu-2. Clusters of three, four, or five adjacent As and Ts are colored. Clusters of As and Ts are separated by approximately 10 bps (~one helical DNA turn) and short An and Tn clusters therefore align along one face of the DNA helix over an extended region (here 1 kb). The PATC algorithm (Fire et al., 2006) assigns a PATC value to every nucleotide of a DNA sequence; higher values indicate that the nucleotide is part of an extended DNA stretch (“PATC-rich region”) with many clusters of An/Tn clusters in perfect 10-basepair register. Less than 0.1% of nucleotides in a random DNA sequence reach a PATC value of 60. The PATC density is defined as the average PATC value of nucleotides in a sequence (See (Fire et al., 2006) and Supplemental Information for details)).
G. Comparison of the PATC density of autosomal, protein-coding genes as a function of chromosome position. Top. Germline-expressed genes (based on > 2 FPKM expression in 1-cell oocytes, (Stoeckius et al., 2014)). Bottom. Genes with no detectable germline expression. Gene distributions were hexagonally binned on a logarithmic frequency scale. A subset of genes used in this study are indicated with arrows.

