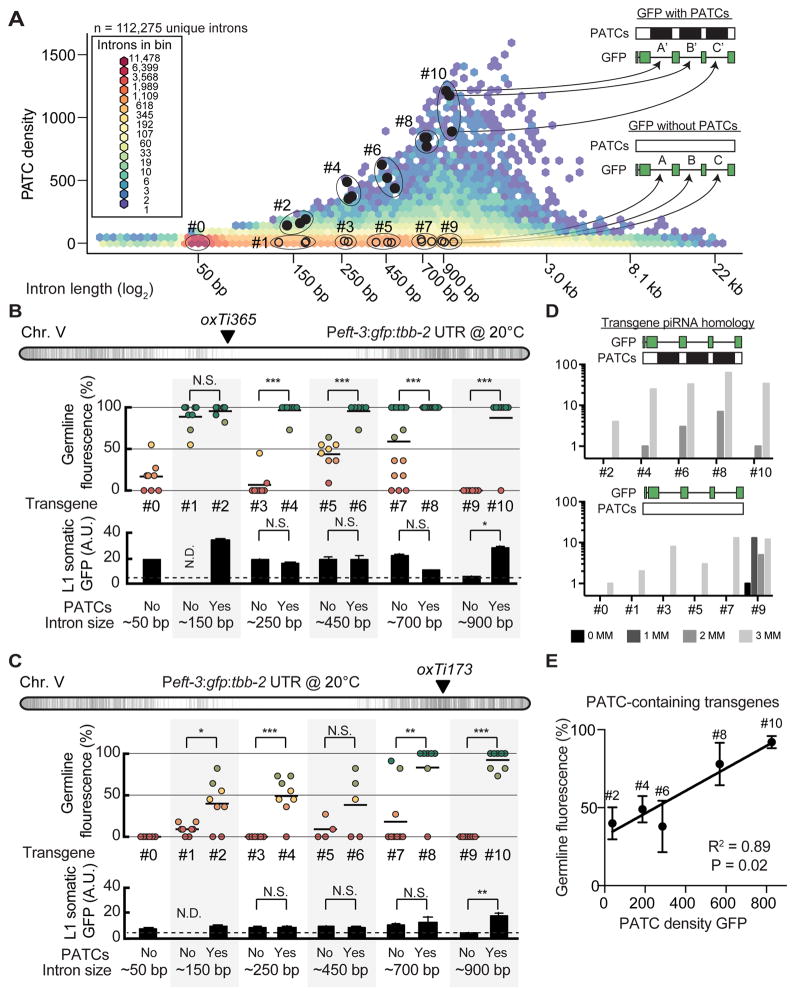
Figure 5. PATC algorithm can identify introns that reduce germline silencing.
A. Hexagon plot showing the PATC density of all predicted, unique introns extracted from protein-coding genes (WS245). Introns tested in panel B are indicated by closed black circles (high PATC density) and open circles (low PATC density). Each individual intron with high PATC content (top) was matched to an intron with low PATC content (bottom) based on two parameters: (1) intron length and (2) germline expression of the parent gene (both within 10%).
B. Germline (top) and somatic (bottom) expression at 20°C from single-copy Peft-3:gfp transgene insertions at a central, permissive chromosome location (oxTi365).
C. Germline (top) and somatic (bottom) expression at 20°C from single-copy Peft-3:gfp transgene insertions at a distal, repressive chromosome location (oxTi173).
Panel B–C. Statistical test: Mann-Whitney (* P < 0.05, ** P< 0.01, *** P< 0.005, N.S. = not significant, N.D = no data).
D. piRNA homology with zero (0MM), one (1MM), two (2MM), or three (3MM) mismatches to the sequence of each numbered gfp.
E. Linear correlation between germline expression and PATC content for PATC-rich transgenes inserted at the repressive oxTi173 location. The P value indicates the statistical significance for a positive slope of the linear fit.
See also Table S3.

