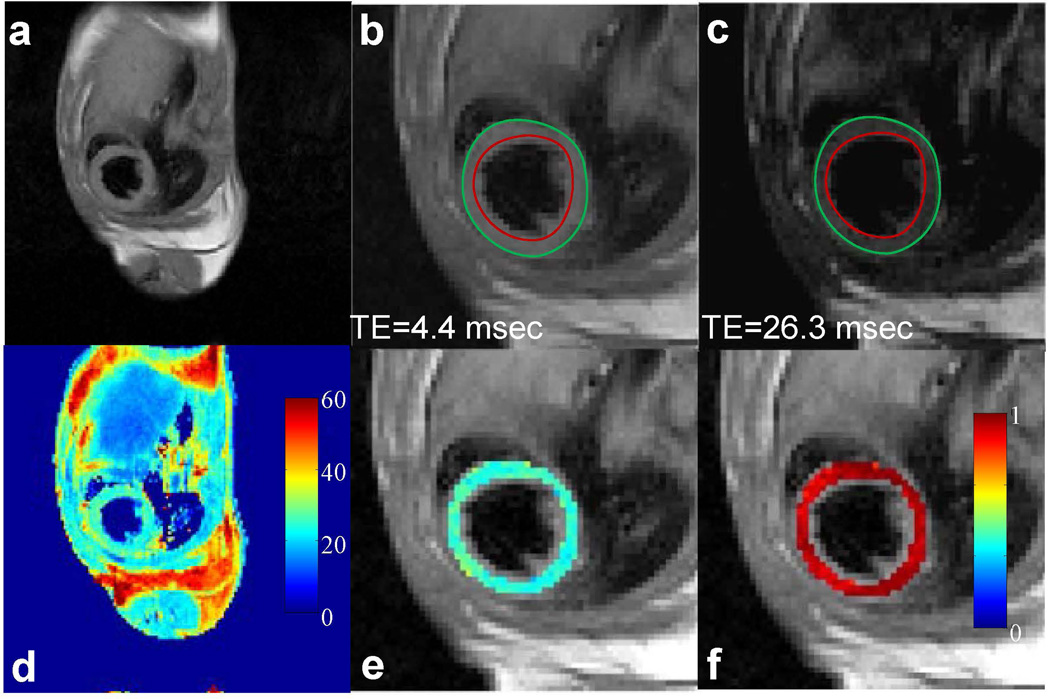
Figure 3.
In vivo T2 mapping of a mouse heart using fully-sampled dataset. (a) Full FOV image of the first echo (TE: 4.4 msec). (b&c) Enlarged images of the heart from the first and sixth echo, respectively. Red and green circles represent endocardial and epicardial contours drawn from the first echo image, respectively. (d) The corresponding T2 map for the whole image. (e) Enlarged T2 map for the mouse heart. (f) Map of squared correlation coefficient for the exponential T2 fitting.

