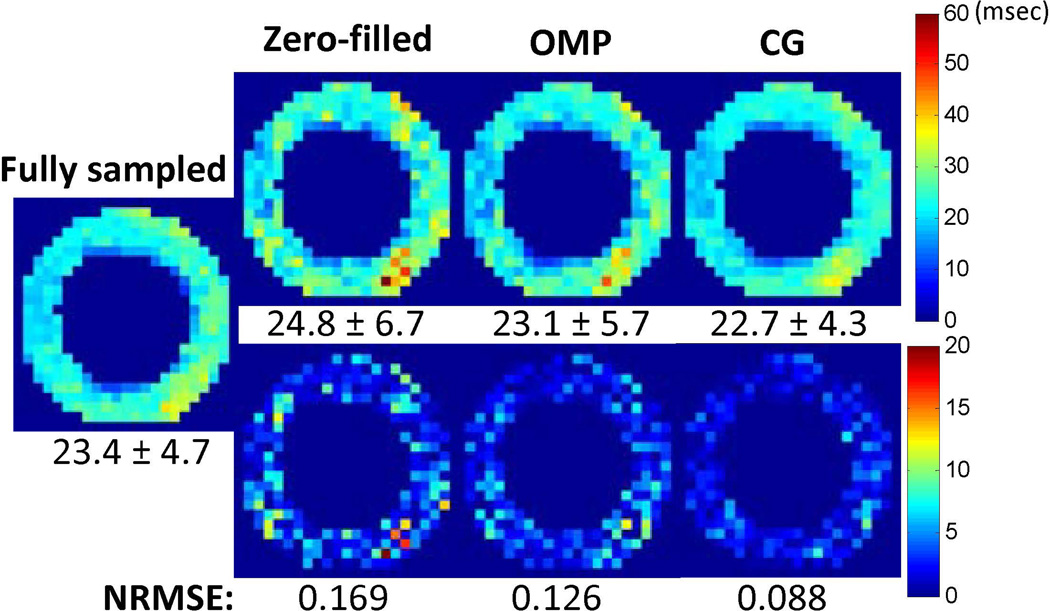
Figure 5.
Compressed sensing reconstruction from retrospectively under-sampled in vivo images. (Top) T2 maps obtained from zero-filled method, OMP method and CG method. Average T2 values (msec) across the myocardium are shown at the bottom of each image. (Bottom) Difference maps as compared to the result from fully-sampled case. The NRMSE values are presented at the bottom of each image.

