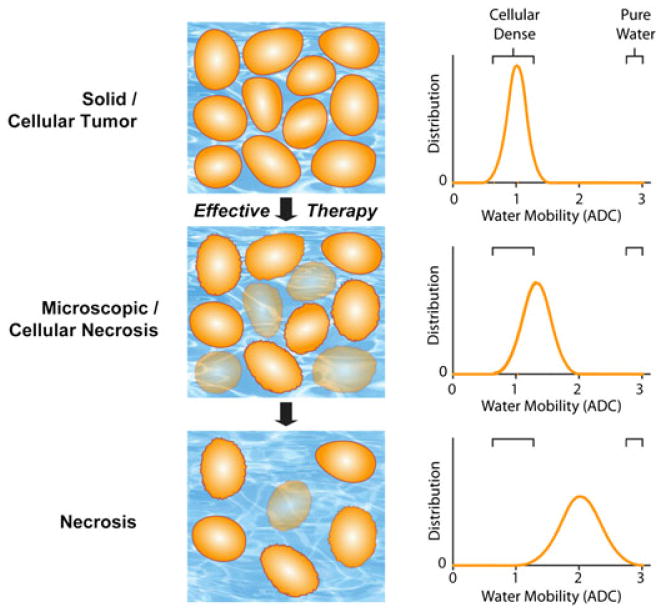
Figure 1.
Schematic diagram of changes in water diffusivity in a tumor following an effective therapeutic agent. Changes in cellularity (left) occur with increasing molecular water mobility, measured as the apparent diffusion coefficient (ADC; right), as a tumor responds to treatment (top to bottom). As a tumor responds to therapy, an increase in extracellular space and membrane permeability occurs, which allows for increased water mobility, and is detected by diffusion-weighted MRI (DW-MRI) as an increase in ADC values. [Courtesy of ref. (18).]

