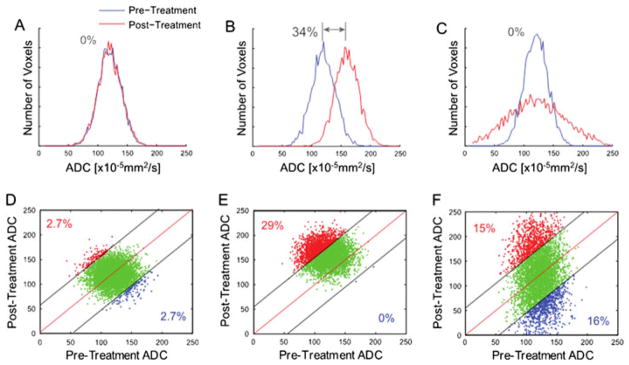
Figure 4.
Simulated comparison of whole-tumor histogram analysis (top row; blue line, pre-treatment tumor data; red line, post-treatment tumor data) versus the corresponding voxel-based analysis using a joint density histogram (bottom row). Histograms from tumors with no major change (A), significant uniform shift to higher apparent diffusion coefficient (ADC) values with a 34% net mean change (B) and heterogeneous ADC changes (increased and decreased ADC values) resulting in no net detectable histogram shift (C). Parametric response maps from the corresponding histograms are also shown, where, in (D), the confidence interval for the detection of change was set to 95%, and thus no significant change in red voxels (increased values) or blue voxels (decreased values) was detected. (E) An increase in the number of red voxels was detected at 29% of the total tumor voxels. (F) Both an increase and a decrease in tumor voxels of approximately 15% were detected, whereas no major shift was detected using a histogram analysis of the same data (C). [Courtesy of Ref. (85).]

