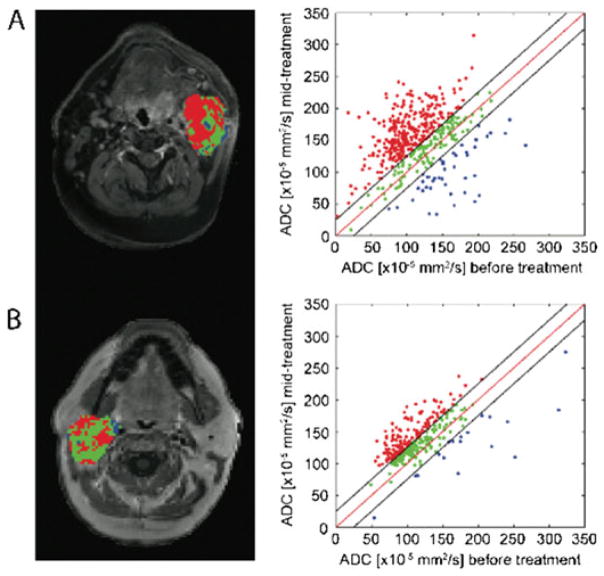
Figure 5.
Functional diffusion mapping (fDM) applied to clinical data acquired from patients with head and neck squamous cell carcinoma (HNSCC) diagnosed as pCR (pathological complete response) (A) and PR (partial response) (B). Results from the fDM analysis are presented as color-coded maps superimposed on contrast-enhanced T1-weighted images and scatter plots with axes pre-treatment ADC (x-axis) and post-treatment ADC (y-axis). Color-coding is as follows: red, increased ADC values; blue, decreased ADC values; green, unchanged ADC values. [Courtesy of ref. (65).]

