Figure 2.
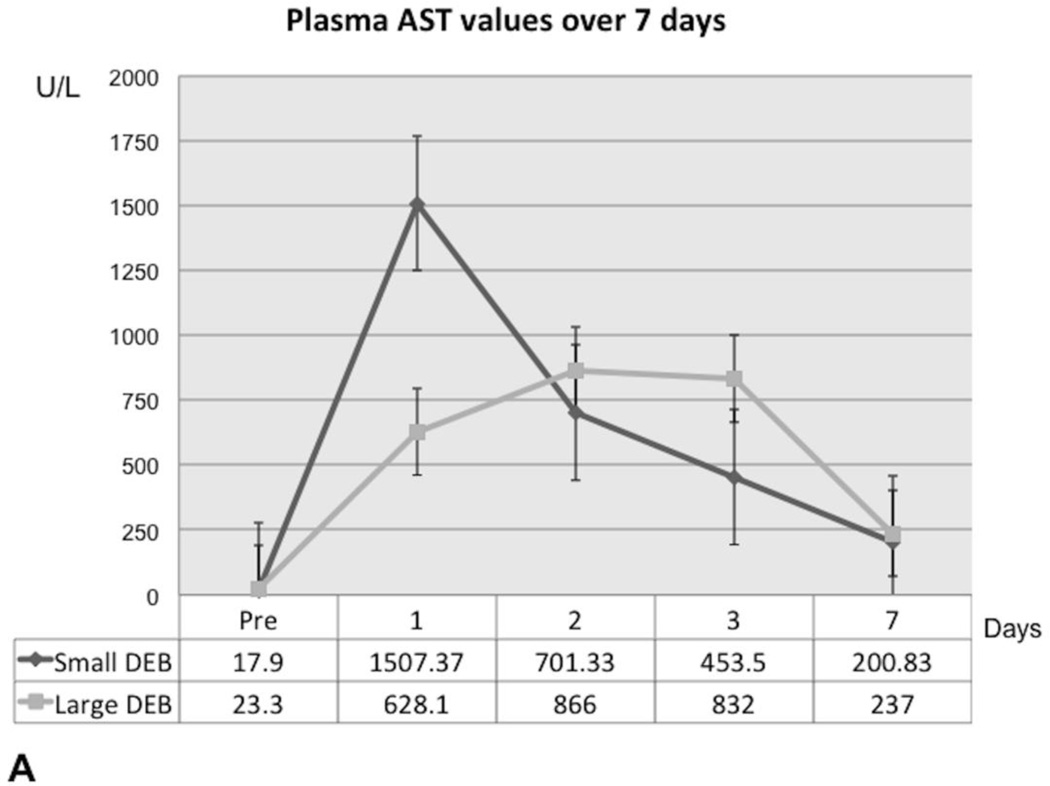
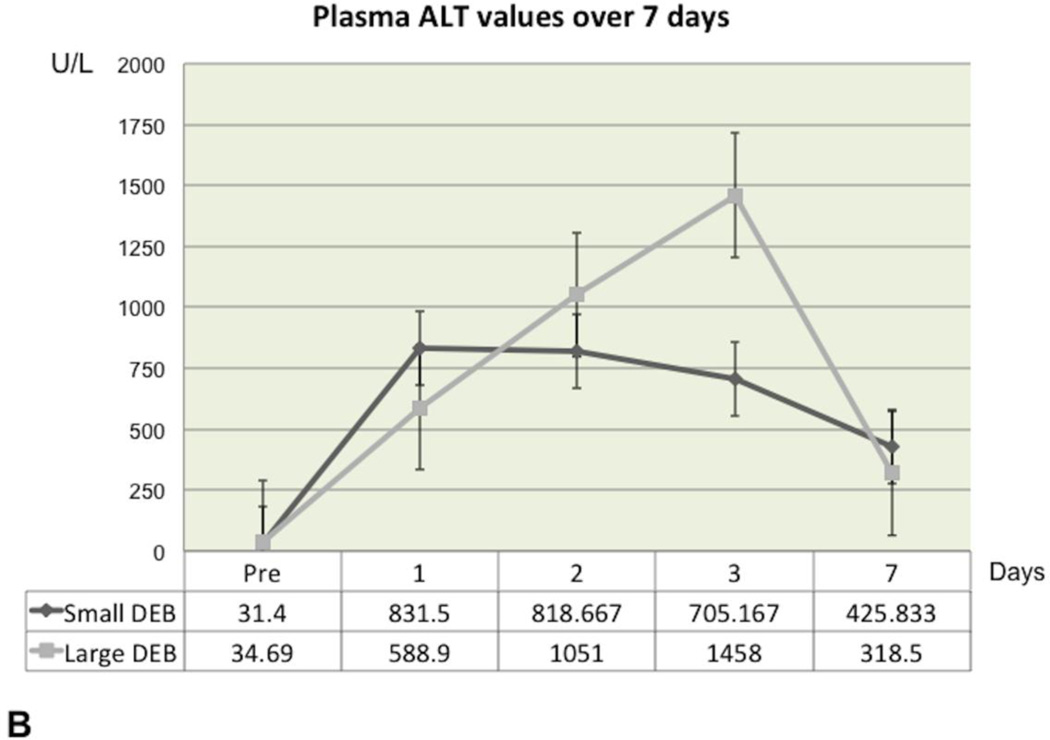
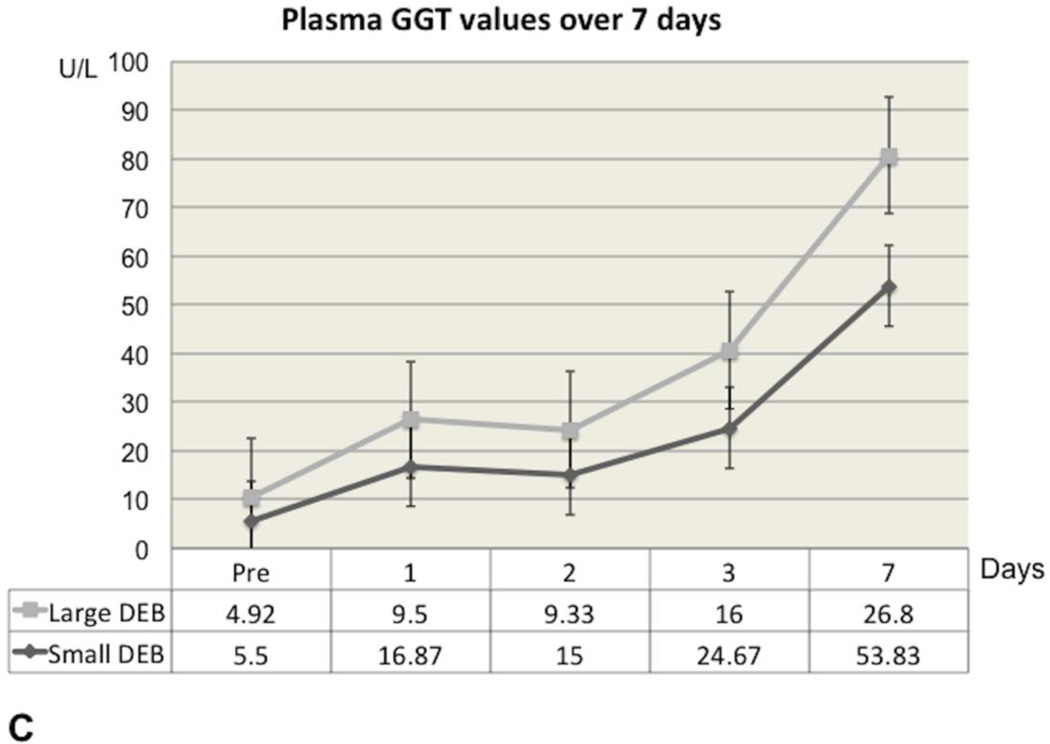
Graphs depicting liver enzyme value (AST, ALT and GGT) changes over the observation time period for the Large and Small DEB Groups.
A. Graph depicting aspartate transaminase (AST) plasma concentration changes over the 7-day observation period, in the Large and Small DEB Groups (expressed in U/L). Note the slightly earlier rise in AST in the Small DEB Group.
B. Graph depicting alanine transaminase (ALT) plasma concentration changes over the 7-day observation period, in the Large and Small DEB Groups (expressed in U/L). Note the slightly earlier rise in ALT in the Small DEB Group).
C. Graph of Gamma-Glutamyl Transpeptidase (GGT) plasma concentrations of liver enzymes over the 7-day time period, for Large and Small DEB Groups (expressed in U/L).


