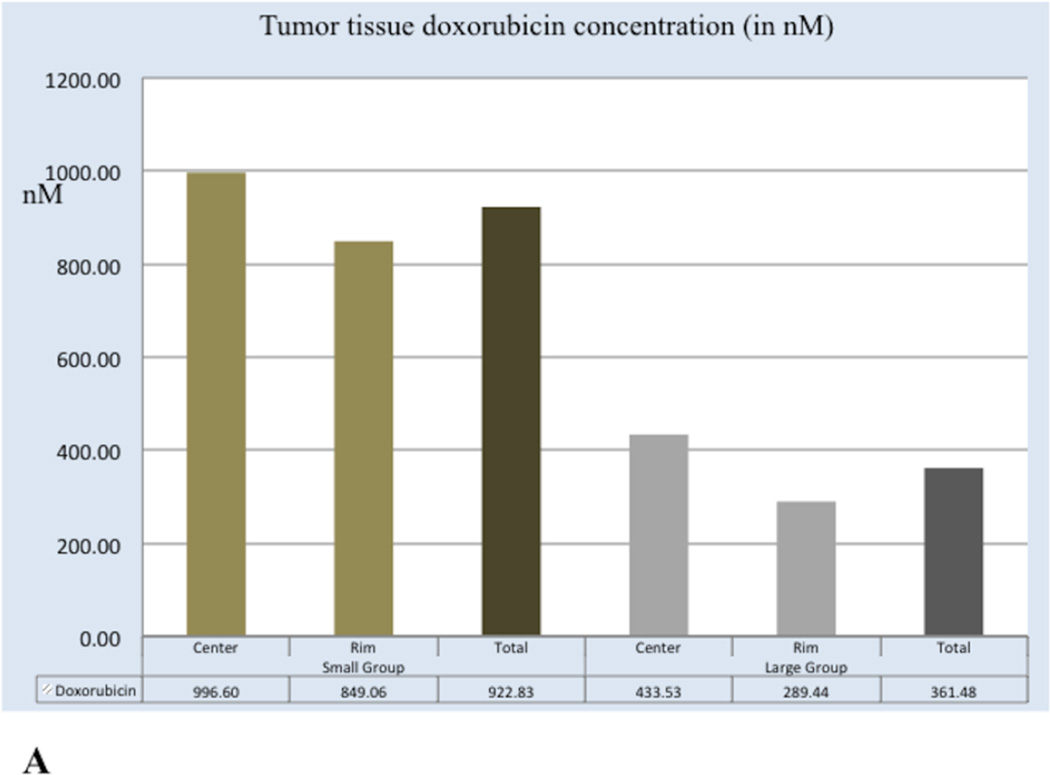
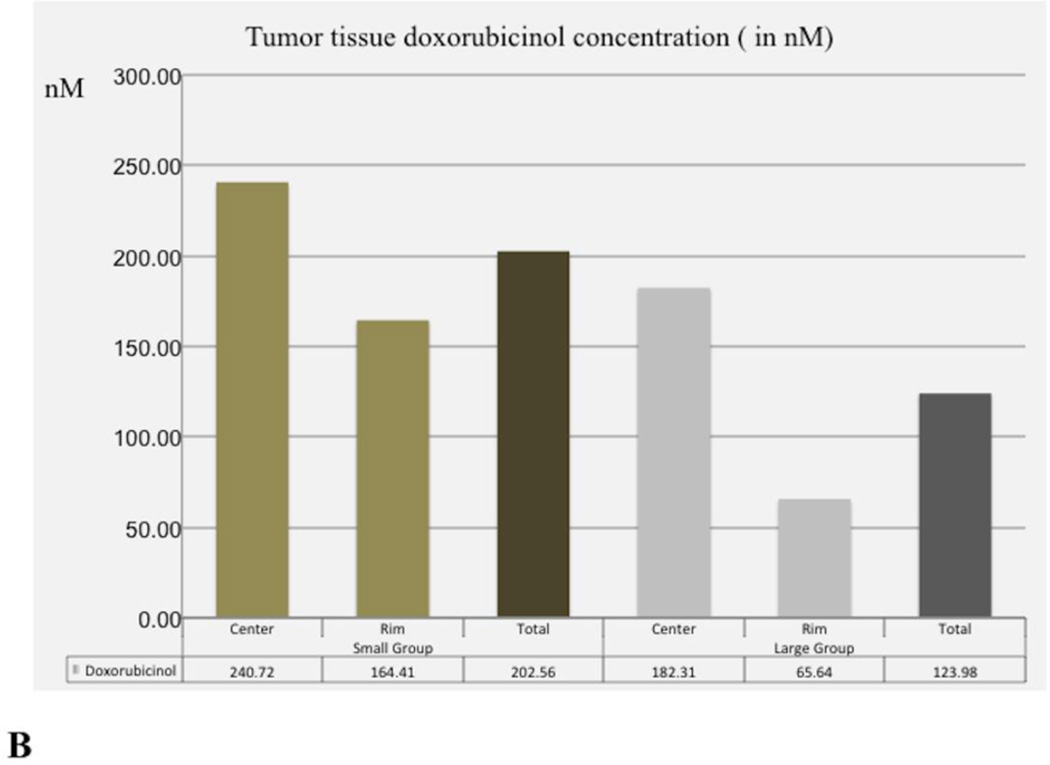
Figure 4.
Graphs depicting tumour tissue doxorubicin (A) and doxorubicinol (B) values in the Large and Small DEB groups at 7 days.
A. Mean doxorubicin concentration values in tumour centre, tumour periphery and overall tumour at 7 days following treatment. Mean doxorubicin values are expressed in nM.
B. Mean doxorubicinol concentration in tumour centre, tumour periphery and overall tumour at 7 days following treatment. Doxorubicinol values are expressed in nM.


