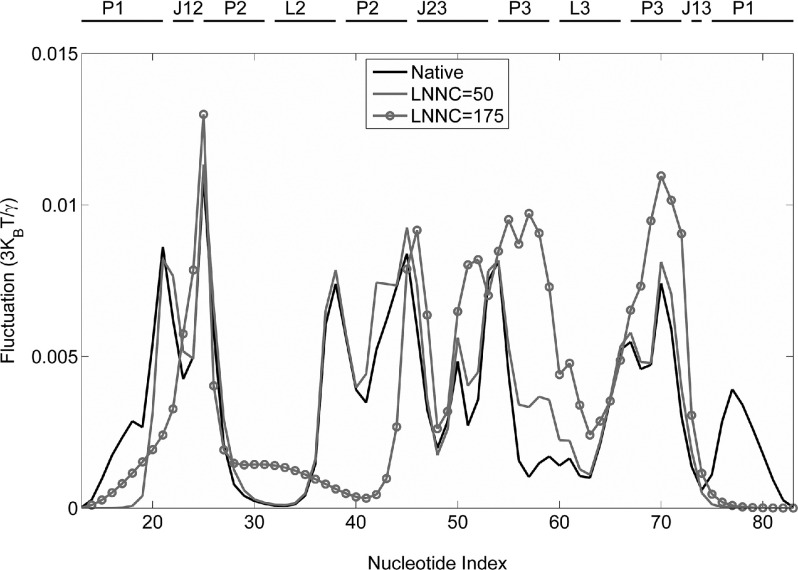
FIG. 6.
The fluctuations of the nucleotides in the fast eight modes from GNM analysis for several conformations visited during the unfolding of add A-riboswitch. The solid, shaded, and shaded circled lines represent the native conformation, the conformations with LNNC = 50 and LNNC = 175, respectively.

