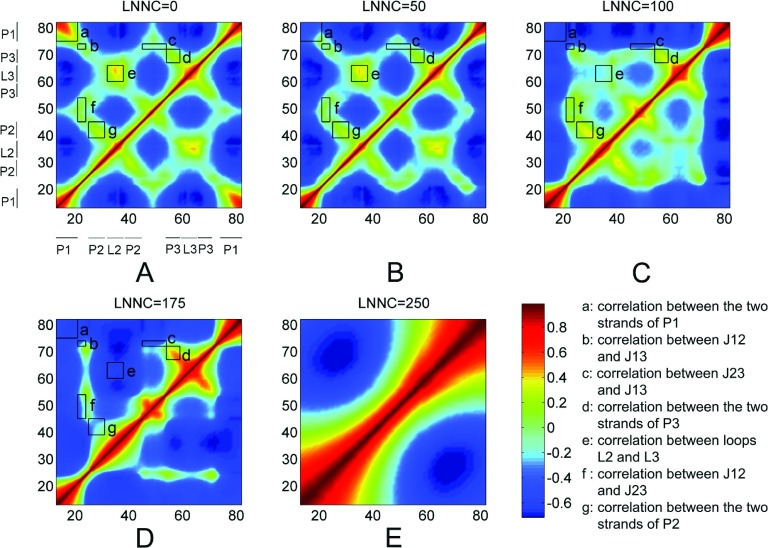
FIG. 7.
The cross-correlation maps calculated using all modes for native conformation (a) and several conformations with LNNC to be 50 (b), 100 (c), 175 (d), and 250 (e) during the unfolding process of add A-riboswitch. As shown in the color bar, the blue regions in the figure indicate negative correlation and the green-yellow-red regions present positive correlation. The rectangles labelled with letters a–g represent the correlations between different secondary structures that are indicated in the lower right corner.

