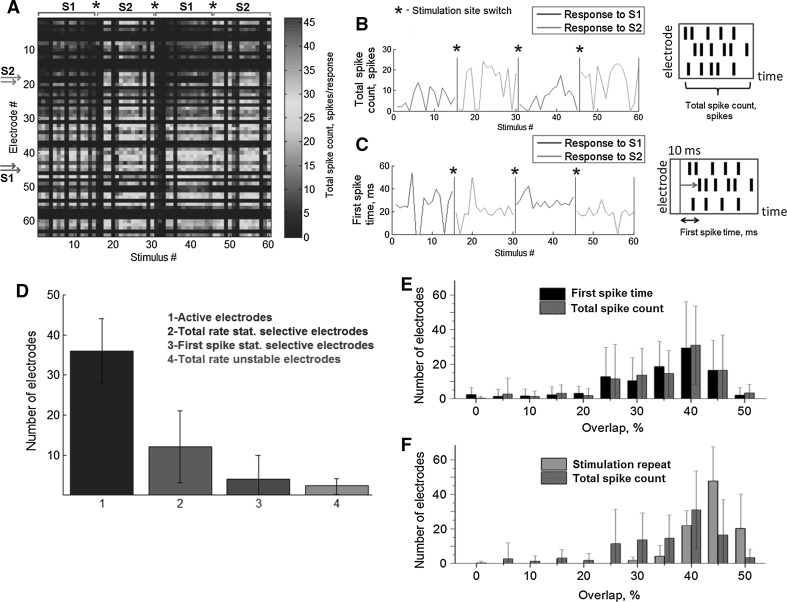
Fig. 2.
a Time course of the responses to the stimuli of two different sites (S1 electrode pairs 18–19 and S2 50–51) during trial stimulation. Each site was stimulated twice by 15 stimulus pulses with 800 mV amplitude. Color represented total spike count for each electrode in each response (see “Materials and methods” section). Example time courses for the b total spike count measure and c burst activation times observed in a single electrode #17 after each 300 ms post-stimulus interval during repetitive stimulation of sites S1 and S2. Asterisk (*) depicts time where stimulation site was switched to another. d The number of active electrodes, statistically selective electrodes identified using the spike rate measure (2) and burst activation times (3) and number of electrodes with unstable responses showing different responses after second stimulation of the same sites (see “Materials and methods” section). e Distributions of the overlaps calculated from the spike rate measure of the responses from two different sites (red bars) and responses from repetitive stimulation of the same sites (brown bars). f Distributions of the overlaps calculated from the spike rate measure and burst activation times. Stimulation repeat—overlaps of the responses evoked from single sites which were stimulated two times with 5 min each. Total spike count—overlaps of the responses evoked from different sites, same as presented on e. (Color figure online)

