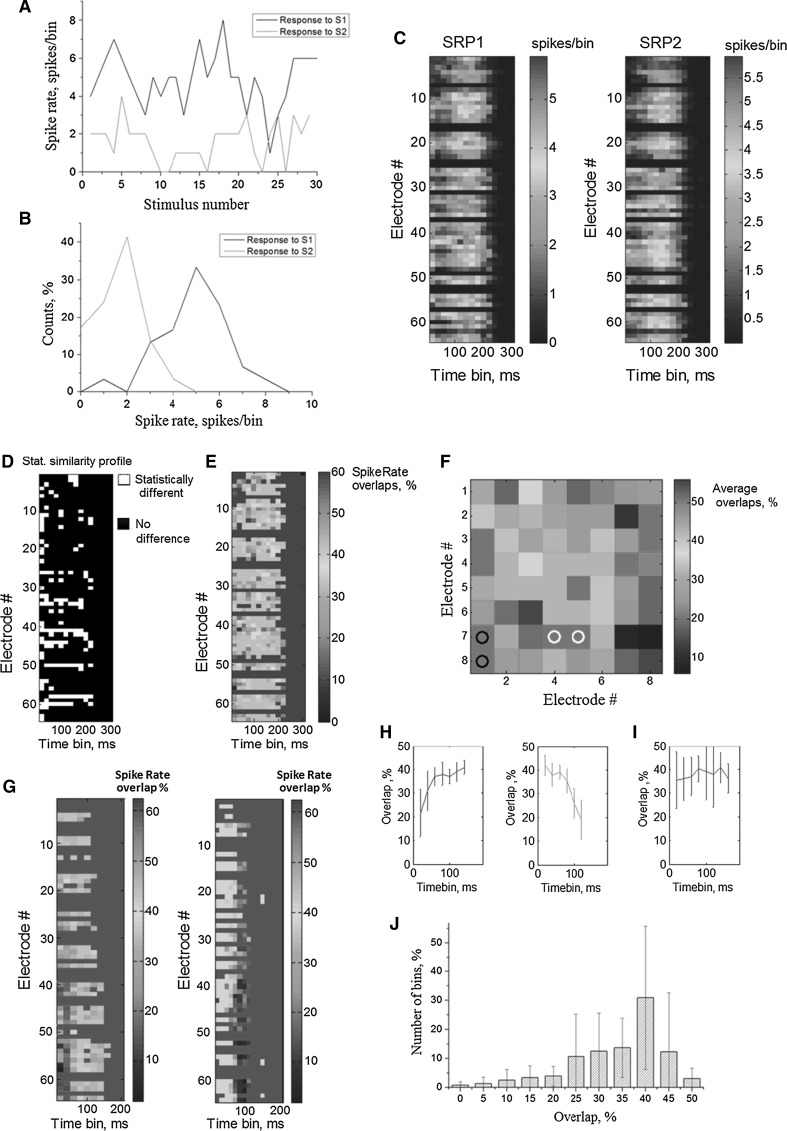
Fig. 3.
a Time courses and b distributions of spikes within single 20 ms time bins for a single electrode in response to the stimulation of sites S1 (black line) and S2 (dashed red line). c Spike rate profiles representing the average number of spikes registered in 64 electrodes for each 20 ms time bin after the stimulus. d Statistical selectivity signature of each time bin and electrode for the responses to two stimulation sites; the time bins of white color correspond to the statistically selective spike rate intervals. e Estimation of the overlap signature. The color grade corresponds to the overlap values (see “Materials and methods” section). f The average overlaps for the first 20 ms post-stimulus interval of the responses from each electrode according to its location on the MEA for one experiment. g The overlap signature for different cultures and stimulation sites. Highest selectivity (lowest overlaps) was observed in the beginning of the responses (left image) or at the end (right image). h Average overlaps for different time bins estimated for two cultures in h (vertical lines—standard deviation). i Average overlaps for different time bins estimated for all experiments (11 cultures, 50 trials). j The distribution of the overlap values within all post-stimulus time bins (11 cultures, 50 trials). (Color figure online)

