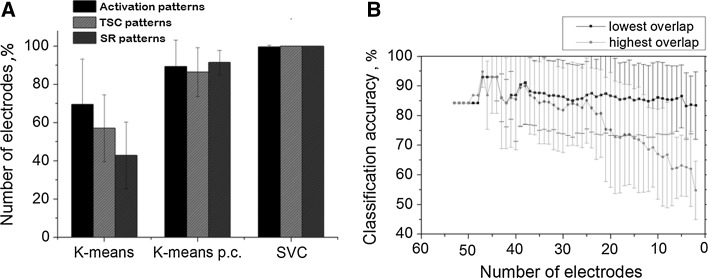
Fig. 4.
a Classification accuracy of population responses with respect to the stimulus response activation time, total spike count (TSC) and the first time bin spike rate (SR). The accuracy was estimated using K-means clustering, K-means clustering with predefined centroids and Support Vector Clustering methods (see “Materials and methods” section) (n = 11, 50 trials). Error bars represent standard deviation. For each characteristic the methods produced significantly different results (t test, p < 0.05) except K-means and K-means p.c. for activation patterns (p = 0.13). b Classification accuracy of the spike rate in the responses estimated by K-means clustering with predefined centroids using patterns comprised of different numbers of electrodes. Black curve patterns comprised of the electrodes with the highest overlap; red curve patterns comprised of the electrodes with the lowest overlap. (Color figure online)

