
Fig. 2.
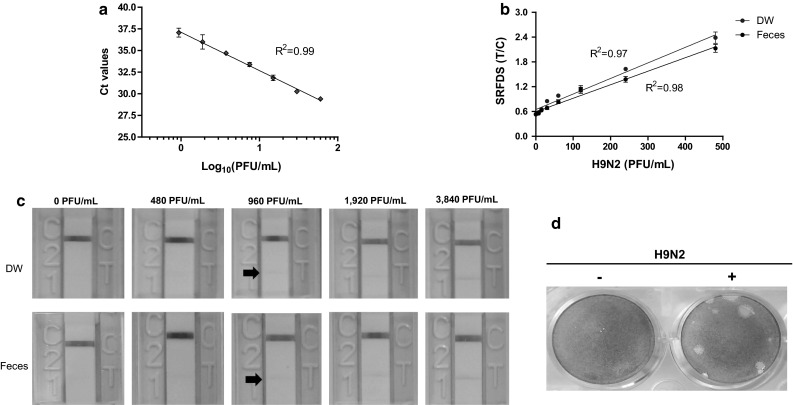
Comparison of virus detection by rRT-PCR, SRFDS, and RDT. (a) After preparing twofold dilutions from of samples ranging from 0.94 PFU/mL to 60 PFU/mL in 10 % (w/v) non-infected chicken fecal suspension, 75 μL of sample was subjected to RNA extraction. The eluted RNAs were used for rRT-PCR. The linear relationship between the threshold cycle (Ct) and log10 concentration of PFU/mL titers after regression analysis are shown. (b) The same amounts of virus (from 0.94 PFU/mL to 60 PFU/mL in DW and fecal suspensions) were tested using the SRFDS for 16 min. (c) A total of 100 μL of virus from 480 PFU/mL to 3,840 PFU/mL in DW and fecal suspensions were tested by AIV RDT for 30 min and read by the naked eye. A faint positive band in the test line (T) was detected at 960 PFU/mL (black arrow), indicating the limit of detection of AIV RDT. (d) The titer of the H9N2 virus was determined by plaque assay. +, infection; –, negative control