Fig. 7 .
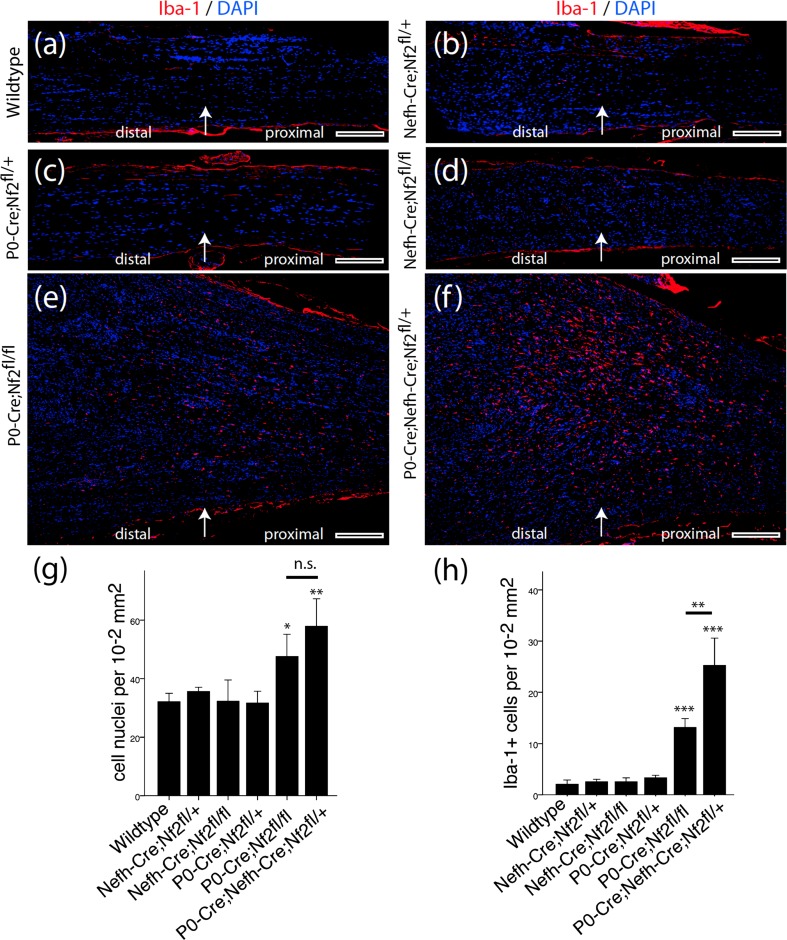
Sustained inflammatory response after nerve crush in P0-Cre;Nefh-Cre;Nf2fl/+ mice. a–f Longitudinal sciatic nerve sections were prepared from indicated genotypes 8 months after crush injury and immunohistochemically stained for the macrophage marker Iba-1 (red). DAPI counterstaining indicates cell nuclei (blue). Arrow in each image shows the position of the nerve crush. Orientation of nerves is stated as ‘distal’ and ‘proximal’. Scale bars represent 200 μm. g Quantification of cellular density in nerve tissue 8 months after crush injury, as measured by the number of DAPI-positive cell nuclei per area of tissue (one-way ANOVA analysis: ***P < 0.001; TMCT comparisons are depicted in the graph: *P < 0.05; **P < 0.01; n.s. not significant; n = 3 nerves per genotype; mean ± SD). h Quantification of Iba-1-positive cells in nerve tissue 8 months after crush injury (one-way ANOVA analysis: ***P < 0.001; TMCT comparisons are depicted in the graph: **P < 0.01; ***P < 0.001; n = 3 nerves per genotype; mean ± SD)

