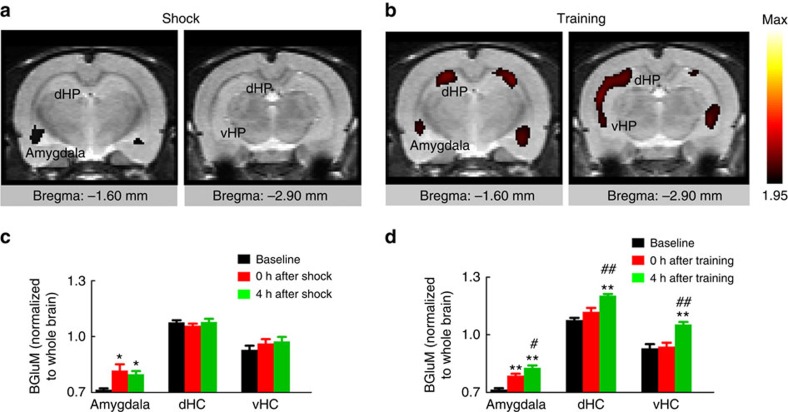
Figure 2. Activity patterns of amygdala and hippocampus in LHF and LHL rats.
(a,b) The representative PET images co-registered to the Schweinhardt MRI template show brain glucose metabolism (BGluM) analysed by Statistical Parametric Mapping (SPM8), normalized to the total brain activity. Red, 0 and 4 h post stimulation>baseline (excitation); P<0.05; Ke>100; T>1.95. The baselines were measured 1 week before foot shocks or with avoidance training, and the activity at the indicated brain regions was calculated by normalized to the total brain activity. (c) Amygdala activation was detected at 0 and 4 h in the shocked group (n=6 per group, one-way analysis of variance (ANOVA), Tukey's multiple comparisons test, *P<0.05 versus baseline). (d) A time-dependent activation from amygdala to dorsal and ventral hippocampus (dHC and vHC) was shown in the trained group (n=6 per group, one-way ANOVA, Tukey's multiple comparisons test, **P<0.01 versus baseline, #P<0.05, ##P<0.01 versus 0 h). Data were presented as mean±s.e.m.

