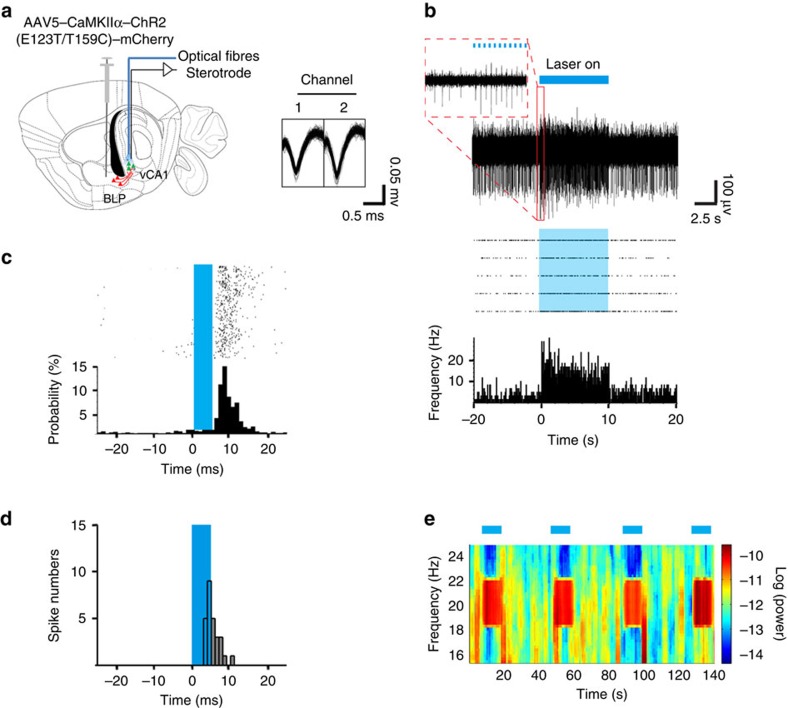
Figure 4. Identification of BLP–vCA1 excitatory monosynaptic connection in naive mice.
(a) Schematics show BLP injection of AAV5–CaMKIIα–hChR2 (E123T/T159C)–mCherry and vCA1 light stimulation, and the representative traces for spike (n=7 cells). (b) Top: an example of vCA1 neurons responded to 20-Hz blue light stimulation of BLP–vCA1 terminals, and the insert (red) show 10 light pulses (pulse width=5 ms) of all. Bottom: the representative peristimulus time histogram (PSTH) and raster plots. (c) PSTH of the representative vCA1 neurons (aligned by the pulse light onset, blue rectangle) reveals its response probability to the blue light stimulus. (d) Histogram of distribution peak response latencies to the onset of light pulses for 27/51 vCA1 neurons (averaged latencies=5.90±1.73 ms). (e) The local field potential (LFP) in vCA1 during photostimulation of BLP–vCA1 terminals at 20 Hz.

