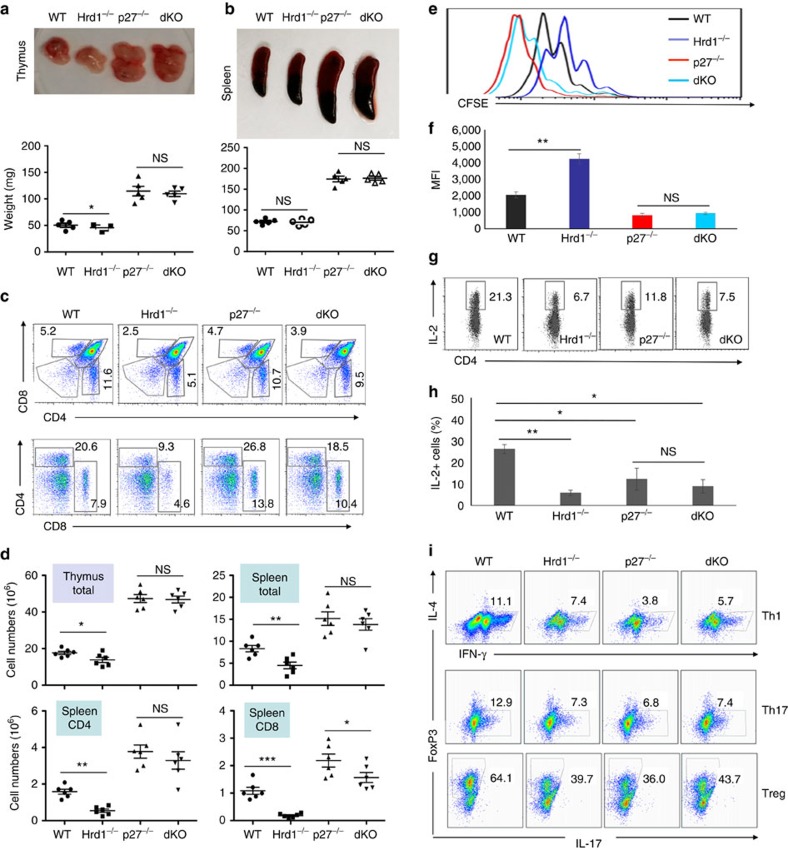
Figure 5. Hrd1 regulates T-cell activation partially through p27kip1.
(a,b) Thymus (a) and spleen (b) were isolated from 8–10-week-old WT, Hrd1 cKO, p27kip1 KO and double KO (dKO) mice. Representative images (top panels) and the weights in milligrams (mg; bottom panels) are shown. (c,d) Single-cell suspensions from the thymus and spleen were analysed by cell surface staining of CD4 and CD8. Representative flow data (c) and the absolute numbers of each indicated population from five sets of mice (d) are shown. (e–h) Naive CD4 T cells from WT, Hrd1 cKO, p27kip1 KO and dKO mice were stained with CFSE and cultured with anti-CD3 plus anti-CD28. Cell proliferation (e,f) and IL-2 production (g,h) were determined. Representative images (e,g) and data from five independent experiments are shown (f,h). (i) Naive CD4 T cells from WT, Hrd1 cKO, p27kip1 KO and dKO mice under Th1, Th17 or Treg polarization conditions. The production of each indicated cytokines or FoxP3 expression was analysed by intracellular staining. Representative images are shown here and the results from five independent experiments are indicated in Supplementary Fig. 8. Mann–Whitney test was used for the statistical analysis. NS, no significant difference; *P<0.05, **P<0.01 and ***P<0.001.

