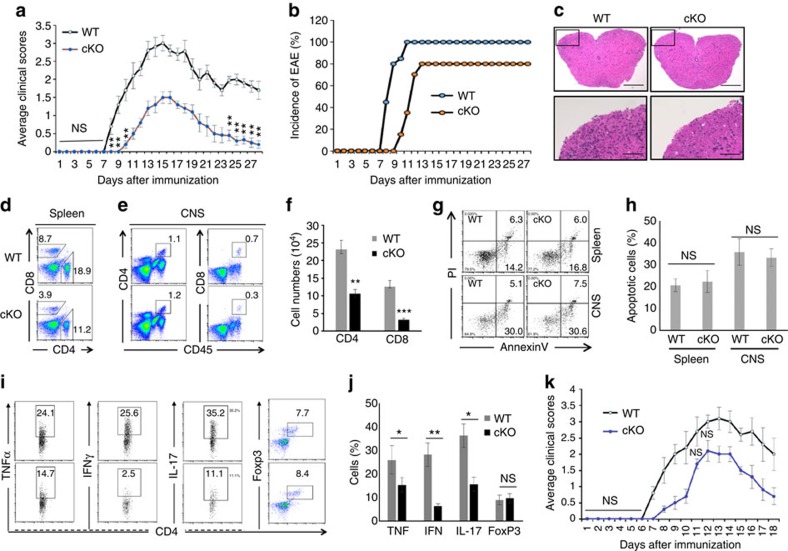
Figure 6. EAE induction in Hrd1 cKO mice.
(a,b) EAE was induced in 8–10-week-old WT and Hrd1 cKO mice, and the symptoms were scored daily. The average symptom scores (a) and disease incidence (b) from 15 pairs of mice are shown. (c–j) The spinal cords were isolated 12–15 days after EAE induction. Representative images of H&E staining are shown; scale bars, 200 μm (top); 10 μm (bottom; c). The splenocytes (d) and infiltrated lymphocytes were isolated and analysed by flow cytometry for each of the indicated cell surface markers (d,e) and apoptosis markers (g). The cytokine production was determined by intracellular staining (h,j). Error bars represent data from five independent isolation (each purification was from spinal cords pooled from three mice; f,h,j). (i) Purified naive CD4 T cells from WT and Hrd1 cKO mice were adoptively transferred into T-cell-null mice. Two days after transfer, EAE induction was performed and the mice were scored for disease development. Error bars represent data from five pairs of recipient mice. Mann–Whitney test was used for the statistical analysis. *P<0.05, **P<0.01 and ***P<0.001. The P value is <0.05 in (a,k) at each scored time point unless specifically indicated.

