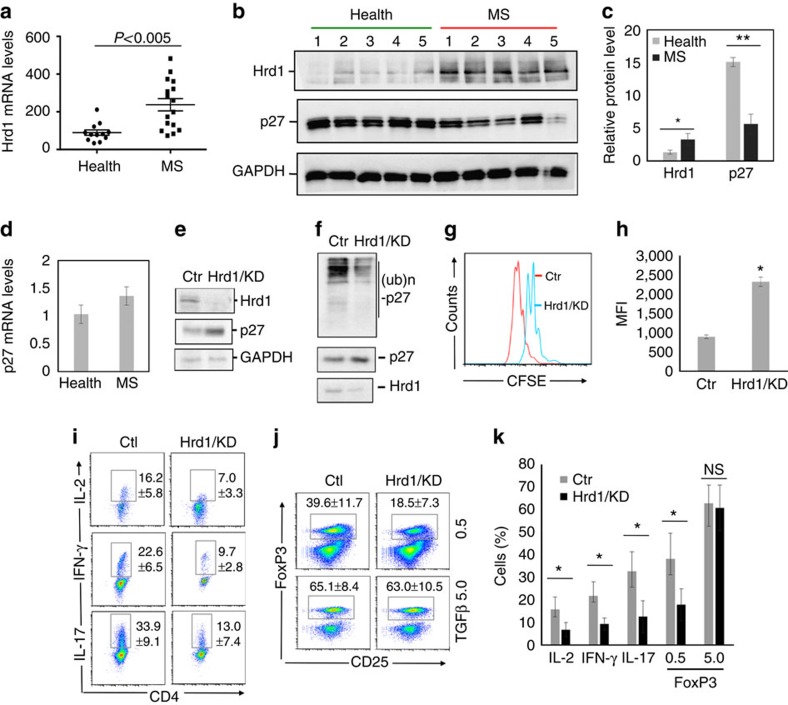
Figure 7. Analysis of Hrd1 expression and functions in human CD4 T cells.
(a) The levels of Hrd1 expression in freshly isolated CD4 T cells from healthy donors (N=12) or MS patients (N=16) by real-time PCR. (b–d) CD4 T cells freshly isolated CD4 T cells from healthy donors or MS patients (N=5) were lysed and subjected to western blotting analysis for the protein levels of Hrd1 and p27kip1 using GAPDH as a loading control (b), and the relative band intensities were quantified (c). The mRNA levels of p27kip1 in samples of (b) were determined by real-time PCR using β-actin as a control (d). (e–k) Purified CD4 T cells from healthy donors were infected with lentivirus carrying control or Hrd1-specific shRNA. (e,f), green fluorescent protein (GFP)-positive cells were sorted, the expression levels of Hrd1, p27kip1 and GAPDH were examined by western blotting (e), and p27kip1 ubiquitination was determined as in Fig. 4a (f). (g,h) Cells were stained with far-red cell trace and cultivated for 3 days with TCR/CD28 stimulation. GFP-positive cells were gated and the proliferation was analysed for CFSE dilution. (h,i) Cells were cultivated under Th1, Th17 and Treg polarization conditions and the gated GFP+ cells were analysed. Representative images (g,i,j) and the percentages from three independent experiments (h,k) are shown. Mann–Whitney test was used for the statistical analysis in a,c,d,h and k.

