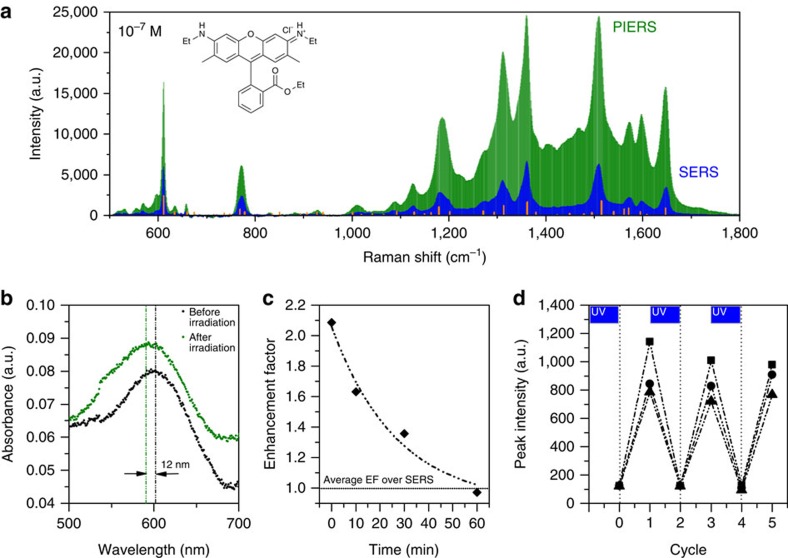
Figure 3. PIERS spectra and examining the PIERS mechanism.
(a) PIERS (green) and SERS (blue) spectra of Rhodamine 6G (10−7 M), with Raman modes of the solid shown by the orange lines. All spectra collected under identical collection conditions. (b) Absorption spectra of a thin film showing LSPR shifts for AuNPs on TiO2 (R) after irradiation with 254 nm light (3 h). Note that the AuNP pre-irradiation LSPR is red-shifted from its solution value, due to the high-refractive index of the TiO2 surface compared with water. Dashed lines indicate peak position (c) Average of total spectral enhancement (EF) of PIERS over SERS for dinitrotoluene (10−9 M) over time (full spectra in Supplementary Fig. 3). Horizontal line indicates the normal SERS intensity. (d) Demonstrating the recyclability of the substrate on irradiation to clean and re-charge for measuring DNT (10–9 M) at three wavelengths, 1,315 cm−1 (squares), 1,367 cm−1 (circles) and 1,385 cm−1 (triangles) (full spectra in Supplementary Fig. 4). Sample irradiation cycles with 254 nm light are marked with blue boxes, then spectra are taken before (on the vertical lines) and after adding DNT, before re-irradiating.

