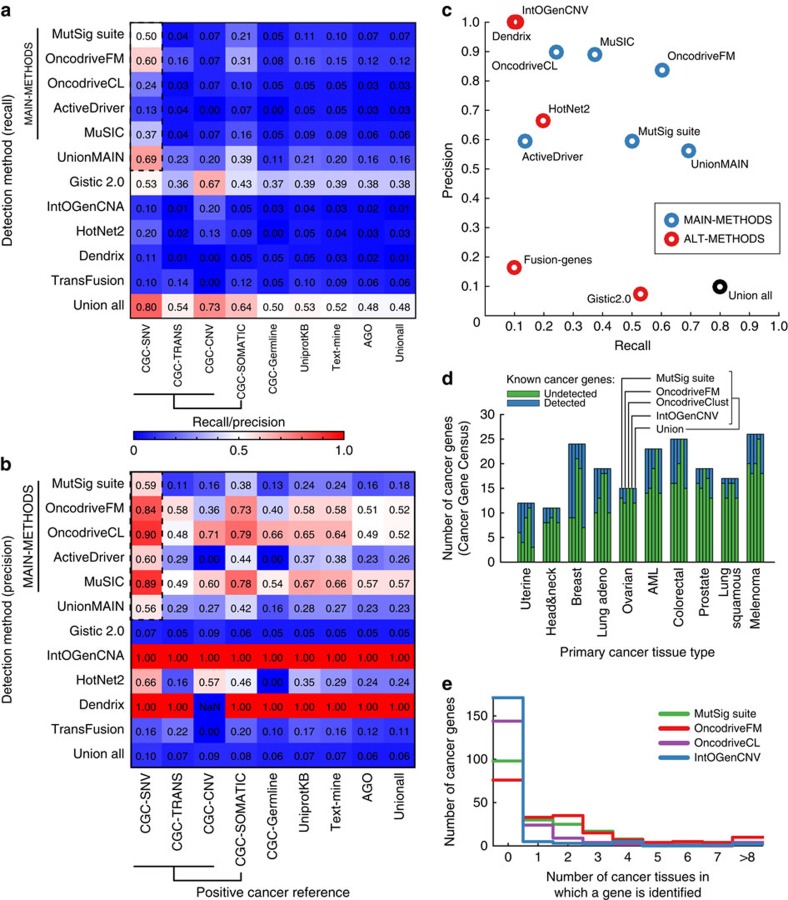
Figure 2. Performance of methods.
Heatmaps showing the (a) recall and (b) precision of each method (rows) tested against each positive cancer reference set (columns). Dashed box highlights the performance of MAIN-METHODS on the CGC-SNV reference set. To compute precision, we assume the proportion of cancer genes is 5% of all human genes; precision values for other proportions are shown in Supplementary Fig. 1 with qualitatively similar results. (c) Precision/recall plot detailing results from a and b for CGC-SNV cancer genes. (d) Summary of CGC-SNV genes curated for particular cancer tissues versus their cancer detection status based on genome analysis by four different methods and their union. (e) Count of CGC-SNV genes as a function of the number of cancer tissue types in which each gene has been detected thus far.

