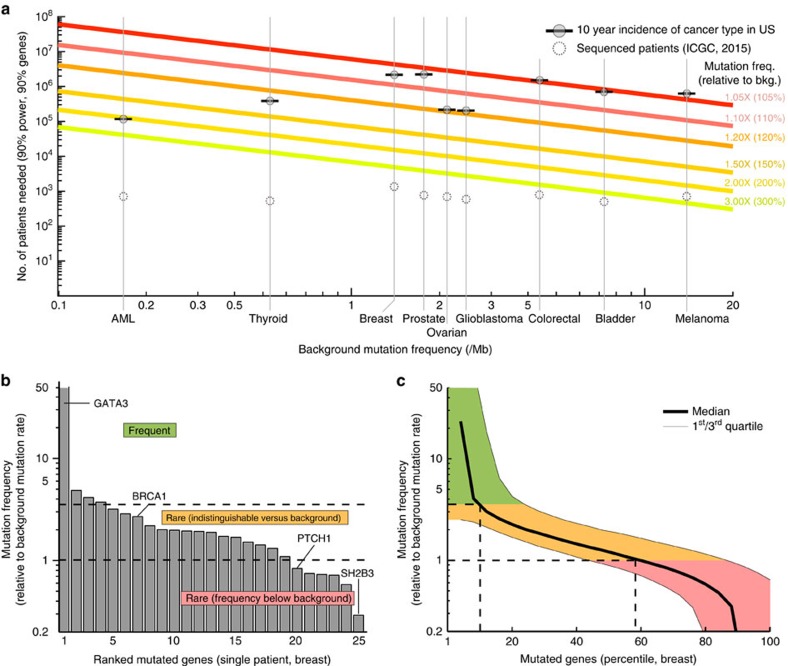
Figure 4. Power to detect recurrently mutated genes as the number of tumour exomes increases.
(a) Number of patient samples (y axis) necessary for detecting a cancer gene, as a function of the background somatic mutation rate of the tissue (x axis) and the fold increase in mutation rate of the cancer gene above this background (coloured lines). The total 10-year U.S. incidences of major cancer types are indicated (grey circles with horizontal bars), along with the number of patients currently sequenced as listed by the ICGC database v20 (dotted circles). (b) Mutated genes of a single breast adenocarcinoma patient, ranked by mutation frequency within tumours of this tissue type. (c) Same analysis showing the median behaviour for 881 The Cancer Genome Atlas (TCGA) patients with breast cancer. Mutated genes in each patient are ranked by mutation frequency; the median mutation frequency over all patients is plotted for each percentile.

