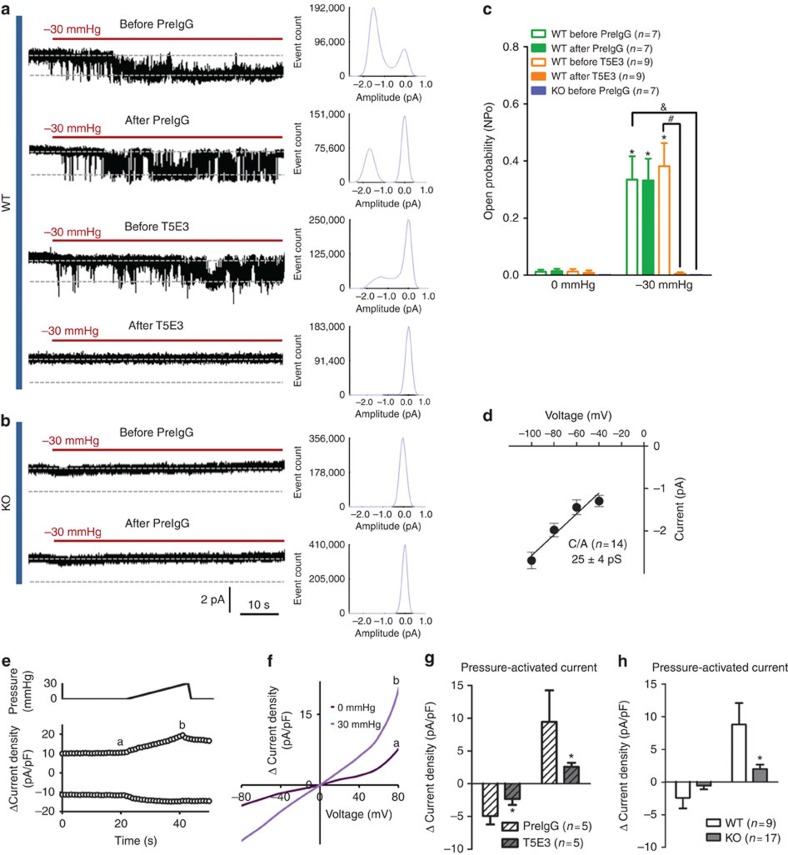
Figure 6. Comparison of TRPC5-like channel between wild-type and Trpc5−/− mice.
(a–c) Representative traces (a,b), their corresponding event histogram (a,b) and summarized data (c) showing a stretch-activated channel in cell-attached patches (c/a) from the somata of DiI-labelled aortic baroreceptor neurons with a holding potential at −60 mV. (a,b) Effect of T5E3 or preimmune IgG on the stretch-activated channel in neurons from wild-type mice (a) and Trpc5−/− mice (b). (c) Summarized single-channel open probabilities (NPo) under different conditions. (d) Single-channel I−V relationship of the stretch-activated channel. (e-h) Whole-cell patch clamp recordings of mouse aortic baroreceptor neurons under different hydrostatic pressures. (e) Representative time course traces showing the whole-cell current change at ±80 mV upon pressure stimulation. (f) Representative whole-cell I–V relationship before (a) and after (b) hydrostatic pressure. a and b correspond to the time point shown in e. Ramp ramps from −80 mV to +80 mV with 500-ms duration were repeated every 1 s. (g) Summary of data showing the effect of T5E3 on the pressure-activated whole-cell current density at ±100 mV. Subtraction of currents under 0 mm Hg from those under 30 mm Hg yielded the pressure-activated currents (Δ current density). (h) Pressure-activated current density change in wild-type and Trpc5−/− mice at ±80 mV. Abbreviations: PreIgG, preimmune IgG; WT, wild type; KO, Trpc5−/−. Mean±s.e.m. *P<0.05 as compared with no stretch in c, to preimmune IgG in g and to WT in h. #P<0.05 as compared with WT before T5E3 at −30 mm Hg in c. &P<0.05 as compared with WT before preIgG at −30 mm Hg in c. Statistical analysis was performed by Student’s t-test.

