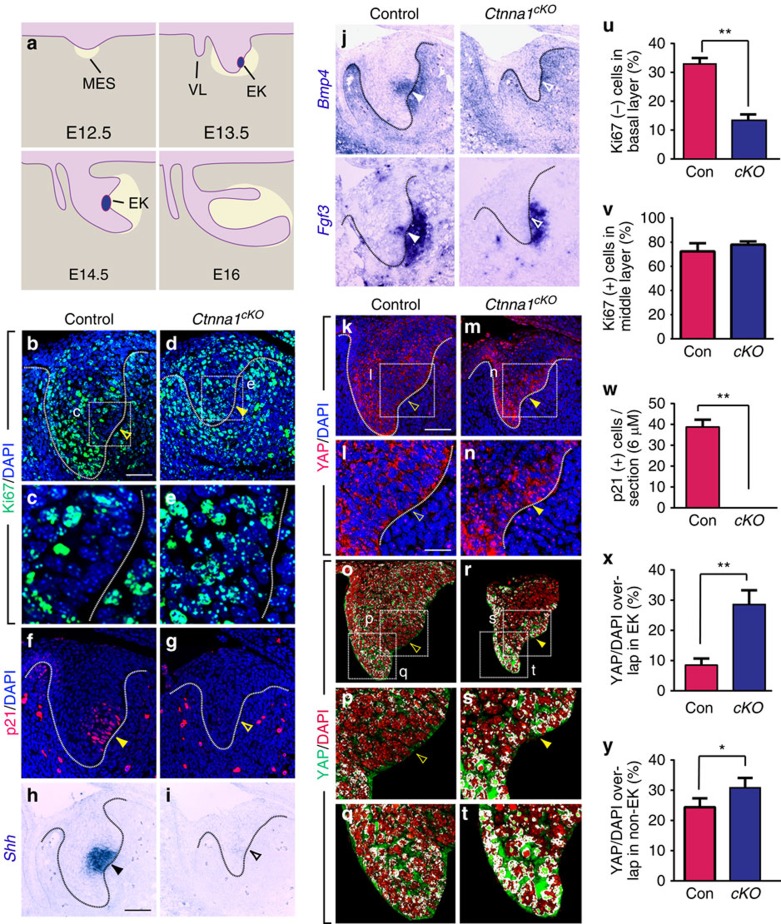
Figure 1. Deletion of Ctnna1 induces YAP nuclear localization as well as cell proliferation and inhibits EK formation.
(a) Schematic diagram of incisor morphogenesis. At E12.5, the dental epithelium (light purple) begins to invaginate into the underlying mesenchyme (MES, tan). By E13.5, the EK is formed. Subsequent epithelial-mesenchymal interactions result in mesenchymal condensation around the epithelium (yellow shaded area). At E14.5, the epithelium turns posteriorly, and the EK regresses by E16. (b,c) At E13.5, the EK consists of post-mitotic cells that are Ki67 negative (open yellow arrowhead). (d,e) Ablation of Ctnna1 (Ctnna1cKO) by K14Cre results in ectopic cell proliferation in this region (yellow arrowhead in c). (f,g) p21 is expressed in the control EK (yellow arrowhead) but not in Ctnna1cKO (compare yellow arrowhead in f to open yellow arrowhead in g). (h–j) EK markers, Shh, Bmp4 and Fgf3, are absent in the Ctnna1cKO (compare black arrowhead in h and white arrowheads in j to open black arrowhead in i and open white arrowheads in j). Mesenchymal Bmp4 and Fgf3 are also reduced. (k,l,o–q) At E13.5, the EK contains mostly cytoplasmic YAP (open yellow arrowheads in k,l), while strong nuclear YAP staining is detected in the surrounding epithelium (q). This is visualized through detection of overlapping signals (white) between YAP (green) and DAPI (red) (open yellow arrowheads in o,p). (m,n,r–t) Deletion of Ctnna1 results in YAP nuclear localization in the presumptive EK (yellow arrowheads in m,n,r,s) and the neighbouring epithelium (t). (u,v) Quantification of Ki67-negative (−) cells in the basal layer (u) and Ki67-positive (+) cells in the area surrounding the EK (v) at E13.5 (mean±s.e.m., n=3, P<0.01). (w) Quantification of p21-positive (+) cells in control and Ctnna1cKO (mean±s.e.m., n=3, P<0.01). (x,y) Quantification of nuclear YAP in the EK region (x) and in the protruding epithelium (y) in control and Ctnna1cKO (mean±s.e.m., n=4, P<0.01 and 0.05 respectively). All quantifications are analysed by using Student's t-test. *P<0.05, **P<0.01. Dotted lines outline the epithelium of the incisor tooth germ. VL, vestibular lamina. Scale bar, 25 μm (b,d,f,g,k,m,o,r); 12 μm (l,n,p,q,s,t); 8 μm (c,e) 50 μm (h,i,j).

