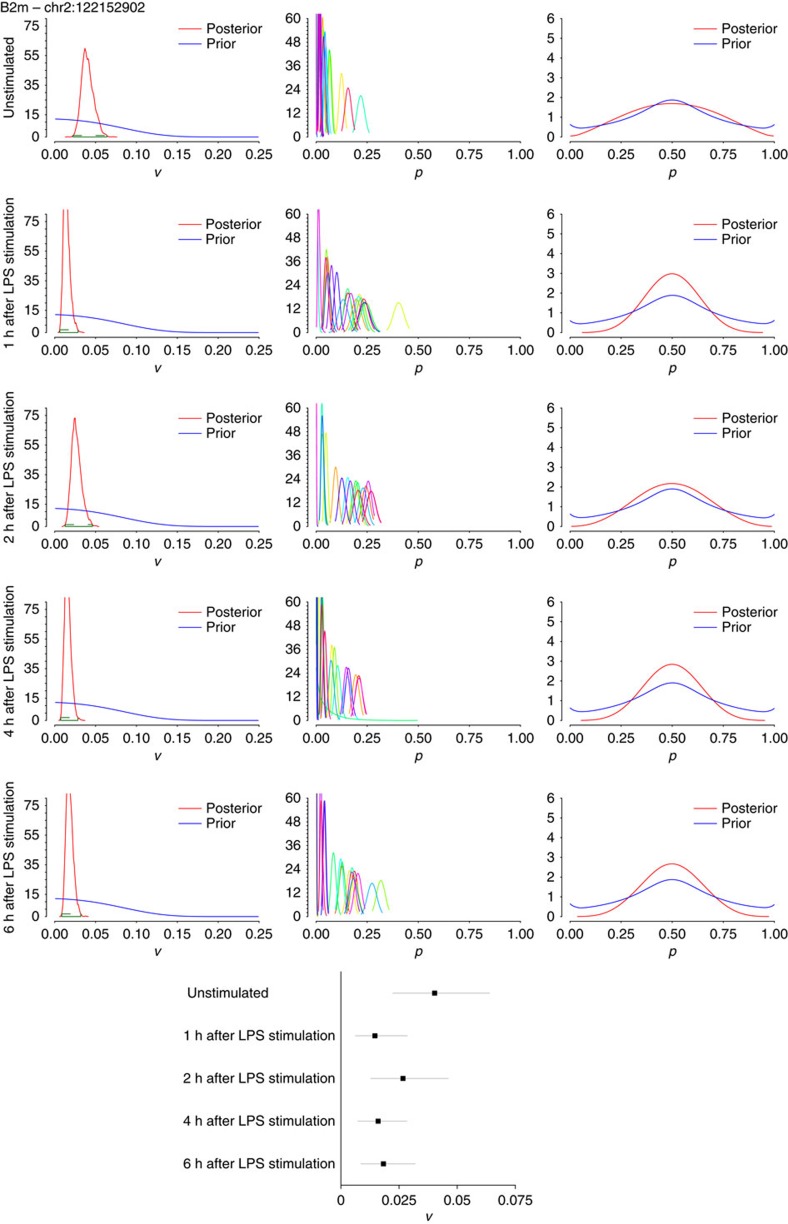
Figure 7. Applying the Bayesian model to dendritic cells 0 to 6h after LPS stimulation for edited site in B2m.
Simulations were run on single-cell data (n=20 data sets each) and bulk data (from 10,000 cells) for B2m—chr2:122152902. Left: histograms of variance of editing rates, across all 20 cells for each site with 95% HDP values, computed from the posterior distribution of the variance, shown in green over each plot; middle: histograms of editing rates, denoting the distributions of editing rates for each cell (each cell is labelled with a different colour); right: marginal editing rate histograms, denoting the distribution of editing rates among cells. The posteriors of v and p have been com̀puted as described in Fig. 5. Each row represents data sets of 20 cells each under the indicated times from LPS stimulation (all data from ref. 16). A forest plot summarizing the 95% HPD intervals calculated from the posterior distribution of variance is shown in the bottom centre, with the line segment for each condition spanning the lower to upper bound of the HPD interval, and the box indicating the mean variance.

