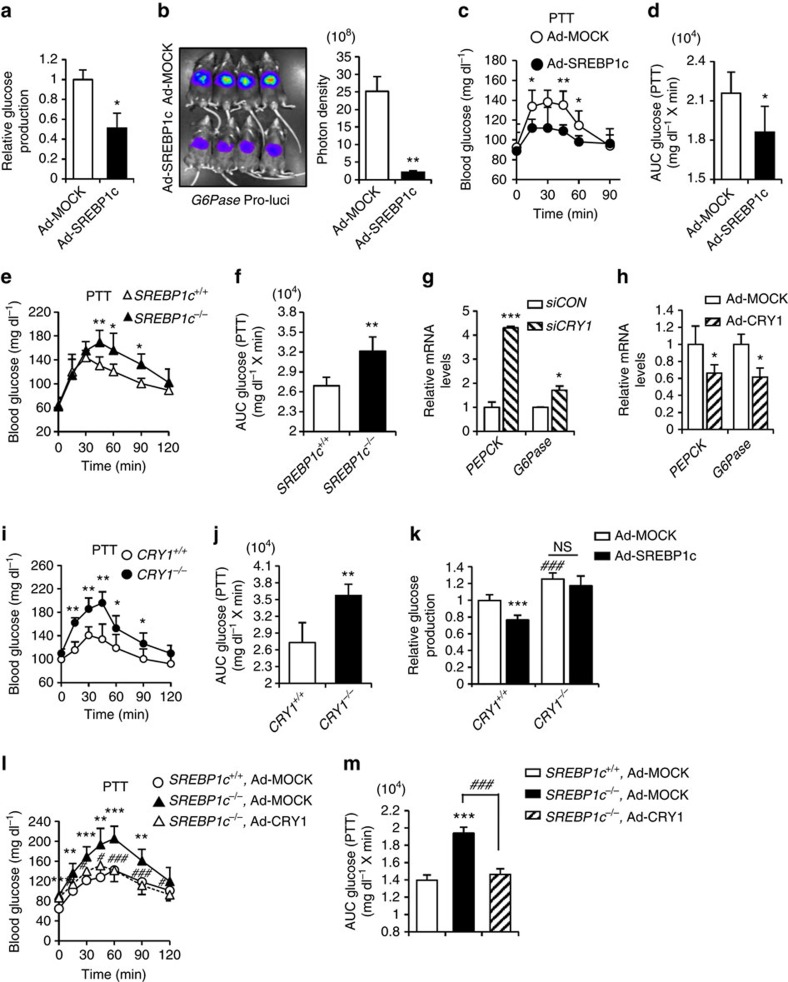
Figure 3. The SREBP1c-CRY1 signalling pathway regulates hepatic glucose production.
(a) Mouse primary hepatocytes were infected with Ad-MOCK or Ad-SREBP1c. Relative glucose production was measured using a glucose oxidase (GO) kit as described in Methods. Data represent mean ±s.d., N=3 for each group. *P<0.05 (Student's t-test). (b) C57BL/6 mice were infected with Ad-G6Pase-luc and either Ad-MOCK or Ad-SREBP1c. G6Pase promoter activity was measured by optical in vivo imaging and photon density. (c,d) C57BL/6 mice were infected with Ad-MOCK or Ad-SREBP1c and performed pyruvate tolerance test (c). All mice were fasted at ZT 10 and performed PTT at ZT 3. Results were converted to area-under-the curve (AUC) (d). Data represent mean ±s.d., N=5 for each group. *P<0.05, **P<0.01 (Student's t-test). (e,f) Pyruvate tolerance test (e) was performed in SREBP1c−/− and SREBP1c+/+mice. All mice were fasted at ZT 10 and performed PTT at ZT 3. Results were converted to AUC (f). Data represent mean ±s.d., N=5 for each group. *P<0.05, **P<0.01 (Student's t-test). (g) H4IIE cells were transfected with siCON or siCRY1. Relative mRNA levels were determined by qRT-PCR and normalized to cyclophilin mRNA levels. Data represent mean ±s.d., N=3 for each group. *P<0.05, ***P<0.001 (Student's t-test). (h) Mouse primary hepatocytes were infected with Ad-MOCK or Ad-CRY1. Relative mRNA levels were determined by qRT-PCR and normalized to TBP mRNA levels. Data represent mean ±s.d., N=3 for each group. *P<0.05 (Student's t-test). (i,j) Pyruvate tolerance test (i) was performed in CRY1−/− and CRY1+/+ mice. All mice were fasted at ZT 10 and performed PTT at ZT 3. Results were converted to AUC (j). Data represent mean ±s.d., N=7 for each group. *P<0.05, **P<0.01 (Student's t-test). (k) Mouse primary hepatocytes isolated from CRY1+/+ and CRY1−/− mice were infected with Ad-MOCK or Ad-SREBP1c. Relative glucose production was measured using a glucose oxidase (GO) kit. Data represent mean ±s.d., N=8 for each group. ***P<0.001 versus Ad-MOCK, ###P<0.001 versus CRY1+/+ (Student's t-test). (l,m) Pyruvate tolerance test (l) in SREBP1c+/+ mice injected with Ad-MOCK and in SREBP1c−/− mice injected with either Ad-MOCK or Ad-CRY1. Results were converted to AUC (m). All mice were fasted at ZT 10 and performed PTT at ZT 3. Data represent mean ±s.d., N=7–10 for each group. **P<0.01, ***P<0.001 versus SREBP1c+/+, Ad-MOCK, #P<0.05, ###P<0.001 versus SREBP1c−/−, Ad-MOCK (Student's t-test).

