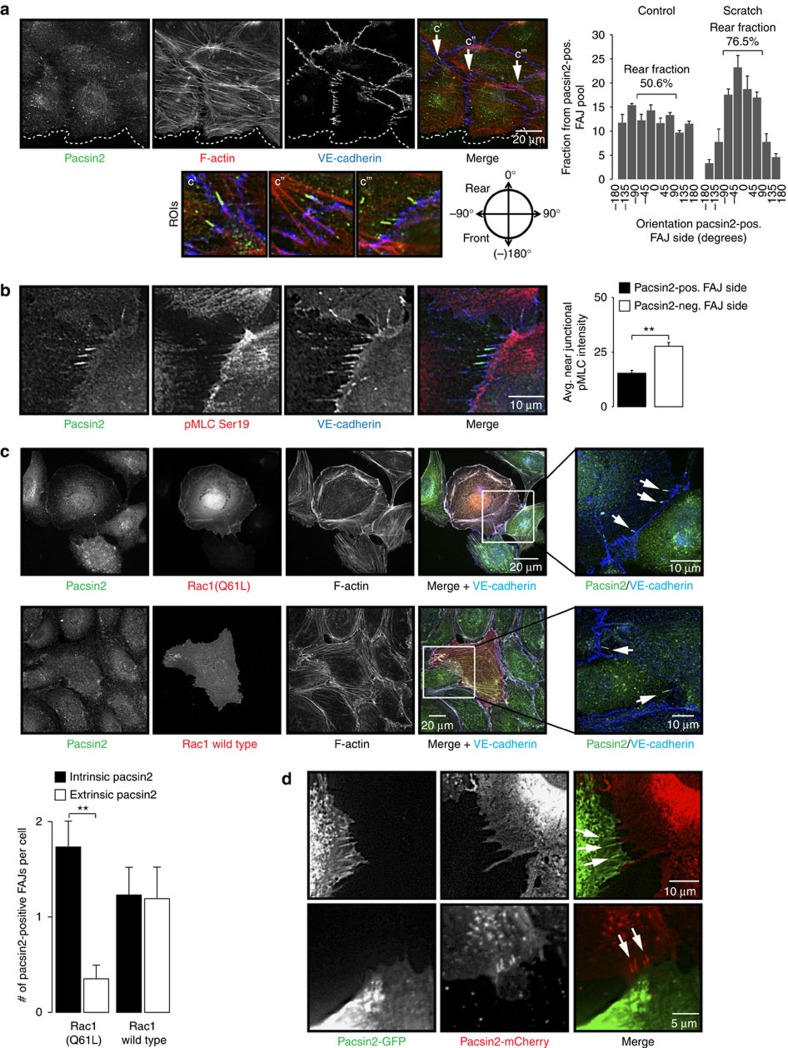
Figure 3. Asymmetric actomyosin organization between cells recruits pacsin2 to FAJs.
(a) Widefield IF images of polarized migrating HUVECs in a scratch-wound assay that are stained for pacsin2 (green), F-actin (red) and VE-cadherin (blue). Arrows indicate the presence of pacsin2 at the rear ends of FAJs. Dotted line represents the leading front of the wound-closing HUVECs. The lower panels represent enlargements of three regions of interests from the merge image. Graph shows the average fraction from pacsin2-positive FAJs that are orientated in the indicated degree in relation to the scratch wound in IF images taken 4 h after wounding or in relation to the bottom (180°) of images of control monolayers. Analysis was performed on four independent experiments and included >250 junctions per experiment. (b) Confocal IF images of FAJs in HUVECs stained for pacsin2 (green), p-MLC Ser19 (red) and VE-cadherin (blue). Graph shows the average local integrated fluorescence intensity±s.e.m. of p-MLC Ser19 at the near junctional area at the pacsin2-positive versus pacsin2-negative side of FAJs. n=41 FAJs analysed from three independent experiments. (c) Widefield IF images of mosaic cultured HUVECs which are non-transfected or transfected with Rac1[Q61]-mCherry or wild-type Rac1-mCherry (red). Cells are stained for pacsin2 (green), F-actin (grey) and VE-cadherin (blue). Graph shows the average number of Pacsin2-positive FAJs in the transfected cells (intrinsic pacsin2) or in the neighbouring cells (extrinsic pacsin2). n=34 Rac[Q61L]-transfected cells and n=26 Rac1 wild-type-transfected cells from two independent experiments. Arrows indicate pacsin2-positive FAJs. (d) Widefield time-lapse images of mosaic FAJs between HUVECs with lentiviral expression of pacsin2-GFP (green) or pacsin2-mCherry (red). See also Supplementary Movie 4. **P≤0.01 (Student's t-test).

