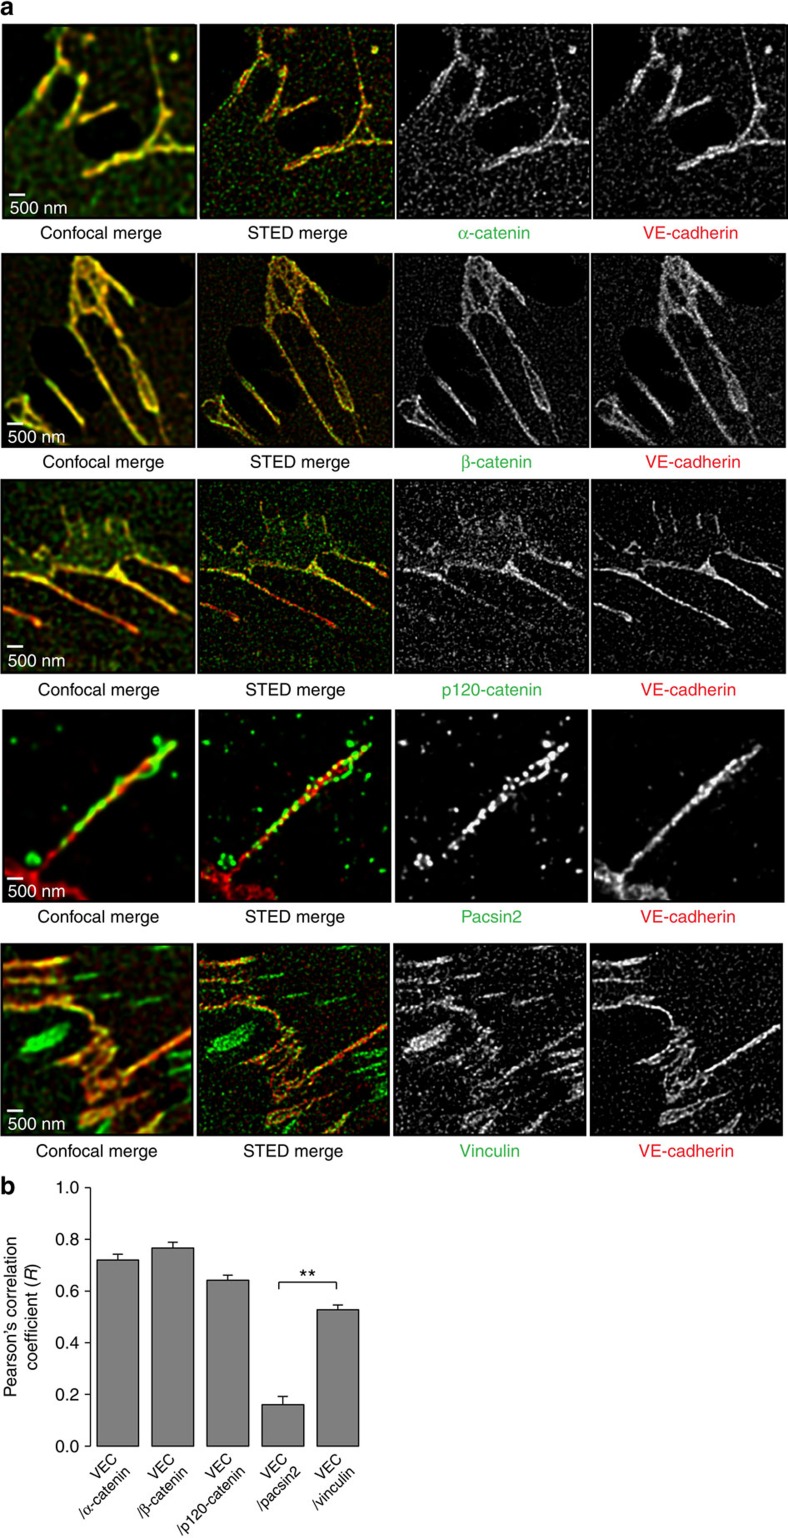
Figure 5. Low correlation of colocalization of pacsin2 and the VE-cadherin complex at super-resolution level.
(a) Representative deconvolved images of stimulated emission depletion (STED) and confocal microscopy performed on IF labelled HUVECs stained for VE-cadherin (red) and catenins, vinculin or pacsin2 (all green). (b) Pearson correlation analysis of pixel intensities between VE-cadherin and indicated proteins at FAJ sections. Graph shows the average Pearson correlation coefficient (R)±s.e.m. of indicated protein pairs, which was determined on junctional region of interests (ROIs) from deconvolved STED images. n≥17 FAJs per correlation analysis. An R of 1 indicates perfect colocalization between two proteins, whereas an R of 0 indicates no correlation. **P≤0.01 (Student's t-test).

