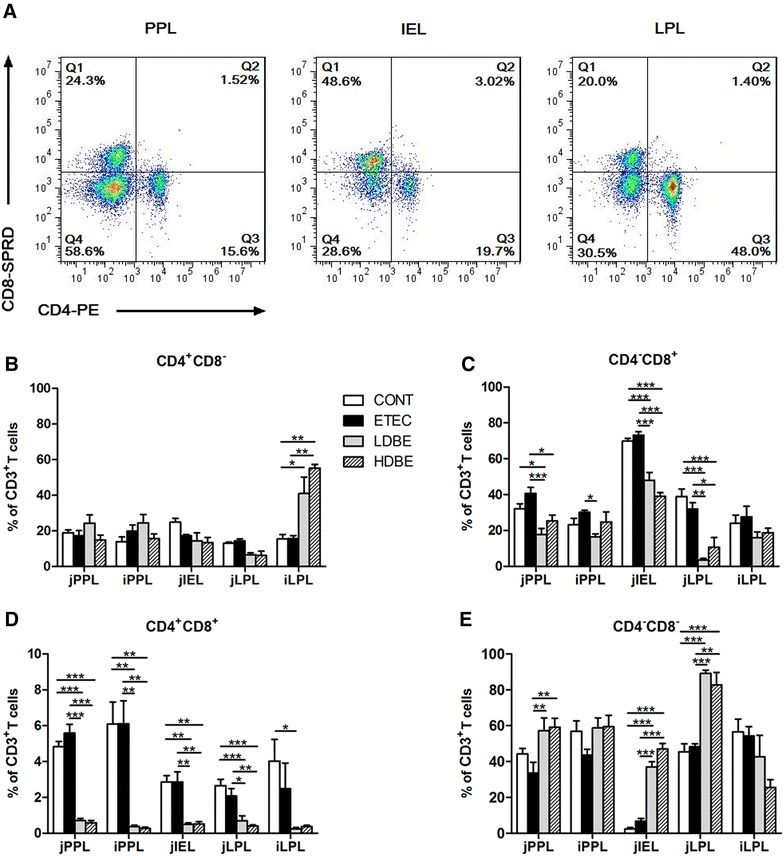
Figure 5.

Effect of orally fed BLS-mix on intestinal lymphocytes. A Representative dot plots showed the gating strategy for gut T-cell subpopulations. Flow cytometry analysis of the percentage of B CD4+CD8−, C CD4−CD8+, D CD4+CD8+, E CD4−CD8− cells among intestinal CD3+ T cells. Peyer’s patch lymphocytes (PPLs), intraepithelial lymphocytes (IELs), and lamina propria lymphocytes (LPLs) were collected from jejunal and ileal tissues from the indicated pigs 1 week after F4+ ETEC/VTEC/EPEC challenge. Data are presented as the mean ± SEM for each tissue (n = 8 per group). *P < 0.05; **P < 0.01; ***P < 0.001.
