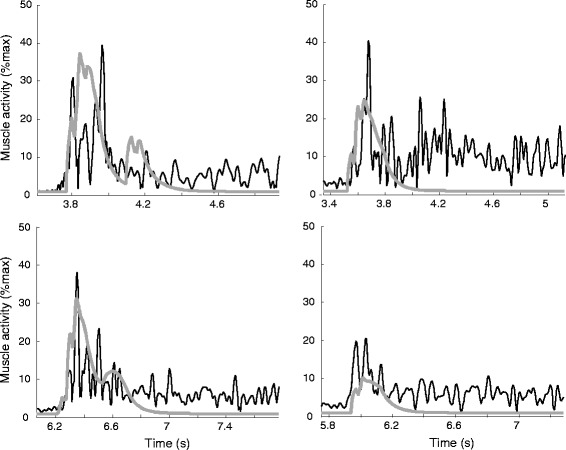
Fig. 4.

Measured EMG (thin black lines) and simulated (thick grey lines) muscle activity. Data are shown for four typical example CP children. Both EMG and simulated muscle activity are shown as a percentage of maximum, for the measured data this maximum was determined during maximum isometric contraction. For each subject, the simulation with the individually tuned optimal gain value is shown
