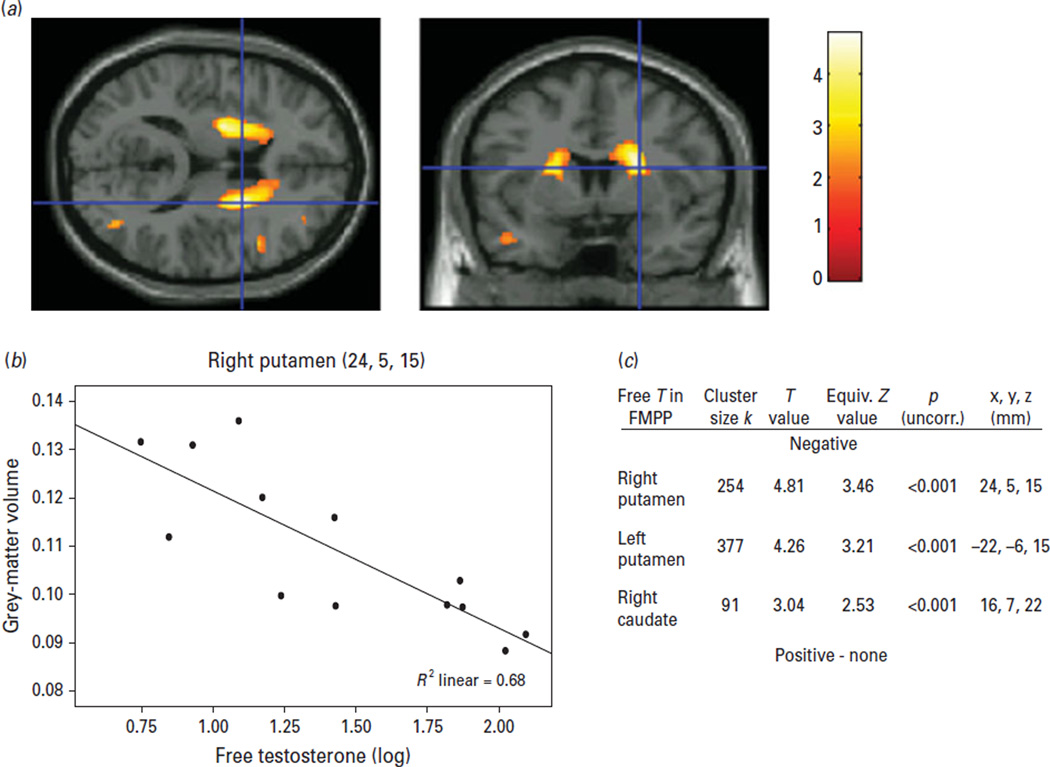
Fig. 3.
(a) Axial and coronal slice illustrating the significant correlation between free circulating testosterone and grey-matter volume (p < 0.05, corrected). Cross-hairs are positioned at MNI coordinates x = 24 mm, y = 5 mm, z = 15 mm. (b) Scatterplot with the mean regression line and individual data-points for the same coordinates as above in the right putamen. (c) Table with cluster size of significant correlation, T and Z values, p value before correction and MNI coordinates.

