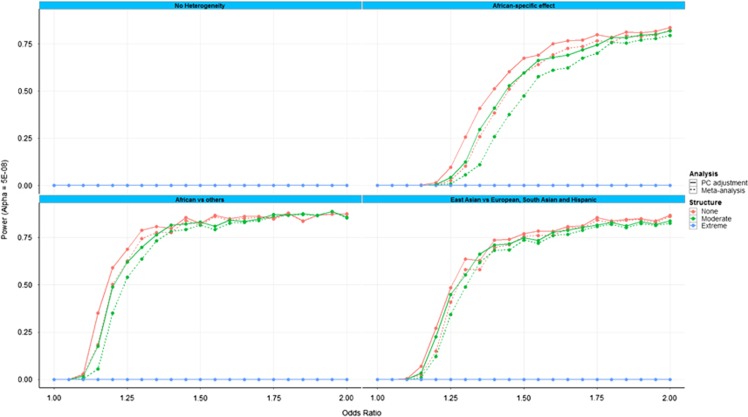
Figure 2.
Power to detect heterogeneity in allelic effects between ancestry groups (at genome-wide significance, P<5 × 10⁻⁸), as a function of allelic effect size for: (i) the logistic regression model by including interactions of the variant with the first two AGV (and with adjustment for the first 10 as covariates); and (ii) Cochran's Q statistic from fixed-effects meta-analysis of summary statistics across populations via inverse-variance weighting of effect sizes. The four panels correspond to alternative models of heterogeneity of allelic effects between ancestry groups (defined in Supplementary Table S1). Within each panel, results are presented for extreme, moderate and no population structure (defined in Supplementary Table S2).

