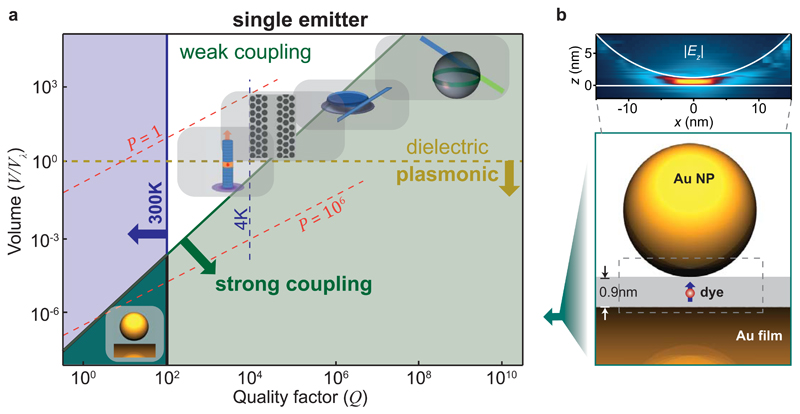
Figure 1. Comparing single molecule optical cavities.
a, Cavity Q-factors and effective volumes (compared to Vλ = (λ/n)3), showing strong-coupling (green), room-temperature (blue), and plasmonic (orange) regimes for single emitters. Icons (from right) show whispering gallery sphere, microdisk, photonic crystal, micropillar, and nanoparticle on mirror geometry (NPoM), with Purcell factor P (red) in µm−3. b, Schematic of NPoM, blue arrow in gap locates emitter transition dipole moment. Inset: simulated near-field of coupled gap plasmon in dashed box with maximum electric field enhancement ∼400, oriented vertically (z).

