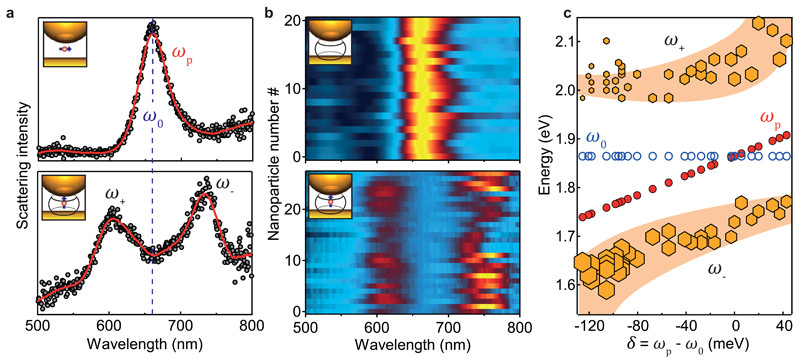
Figure 3. Strong coupling seen in scattering spectra of individual NPoMs.
a, Scattering spectra from isolated NPoM coupled with dye μm oriented (top) perpendicular and (bottom) parallel to |Ez| of gap plasmon (blue dashed line indicates dye absorption wavelength). b, Comparison of scattering spectra from different NPoMs (schematics inset), with gaps filled by CB[7] monolayer which are (top) empty, or (bottom) encapsulating MB dye molecules. c, Resonant positions of MB (ω0), plasmon (ωp) and hybrid modes (ω+ and ω−) as a function of extracted detuning. Marker size depicts the amplitude in scattering spectra.

