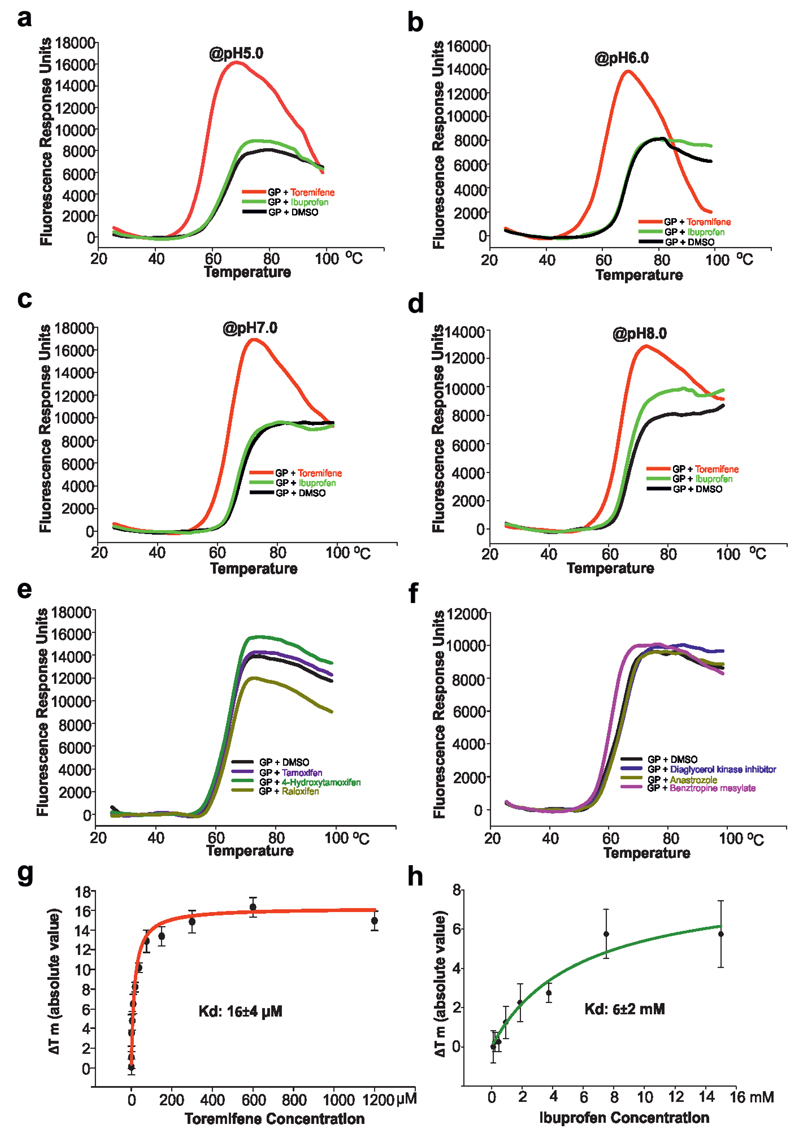
Extended Data Figure 1. Thermal shift essay.
Representative thermal melt curves of EBOV GP with 10 µM compounds and 2% DMSO. a-d, Melt curves of EBOV GP with toremifene, ibuprofen or protein alone at pH 5.0, pH 6.0, pH 7.0 and pH 8.0 respectively. e, Small effects of SERM inhibitors tamoxifen, 4-hydroxytamoxifen and raloxifen on the melting temperature of EBOV GP shown at pH 5.2. f, Melt curves of EBOV GP with diaglycerol kinase inhibitor, anastrozole and benztropine mesylate at pH5.2. g, h, Shifts in melting temperature (ΔTm °C in absolute value) were plotted against different concentrations of toremifene (g) or ibuprofen (h) at pH 5.2. Data are mean ± s.d. (n=4). The affinity constant Kd is calculated by a ligand binding 1:1 saturation fitting with the SigmaPlot version 13 (Systat Software Inc).

