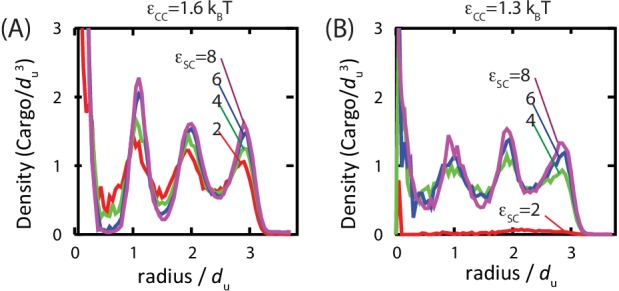
Figure 6. Order of the encapsulated cargo.
The spherically averaged density of cargo molecules inside a shell is shown as a function of radius for (A) and (B) for indicated values of the cargo-shell adhesion strength , measured in equilibrium simulations. The density of the encapsulated cargo ranges from below random close packing to near hexagonal close packing density as and are increased (see Figure 3—figure supplement 3). A snapshot of cargo inside the shell is shown in Figure 5—figure supplement 2. The raw data for this figure is provided in Figure 6—source data 1.
DOI: http://dx.doi.org/10.7554/eLife.14078.022


