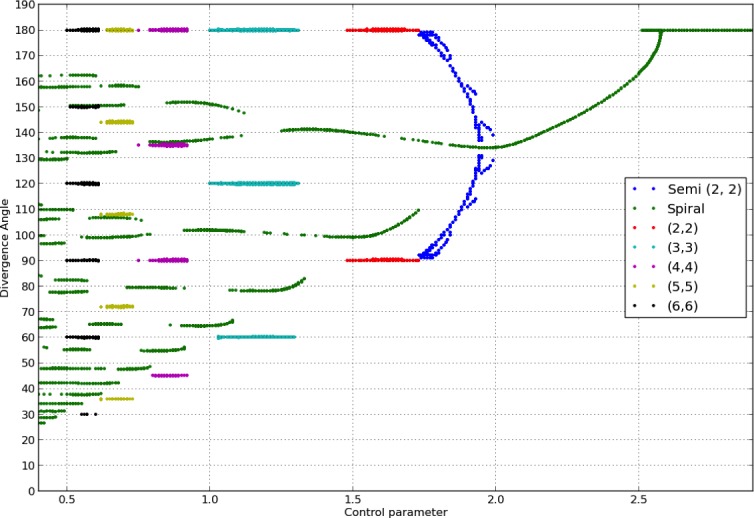
Appendix 1—figure 2. Bifurcation diagram in the Snow and Snow model.

We used a sample of the interval with steps of or less (refinements were performed in areas with higher numbers of branches). For each value of , we ran simulations of the classical model with (i) spiral initial conditions for divergence angles taking integer values in , and plastochrons taking values in a sample of 128 points between and , (ii) whorled initial conditions for the same samples of divergence angles and plastochrons and all jugacies . For each simulation, we estimated the final divergence angle and phyllotactic mode, and reported these in the graph above (abscissa: , ordinate: , color code: mode).
